About Measures Portlets
Measures portlets display tabular data from a cBase, cPlan, marker, DiveBook, or Spectre Dive file. You can customize how the data appears on a portal page by using formatting options, colors, and other visual indicators.

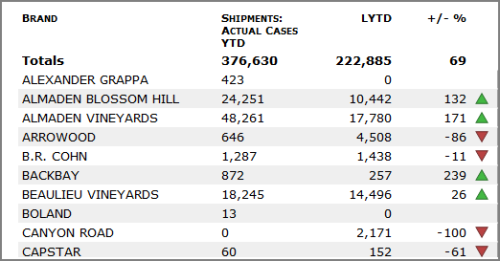
You can specify which summary columns appear on the portlet, and whether the summary data is presented as alphanumeric text or as an indicator. Column data can be used more than once and displayed as different types. In the example above, the change in data values from last year (+/- %) is displayed as text in one column and as an indicator an another column.
You can set the column width on measures portlets. Column data that is longer that the specified column width are truncated and appended with an ellipsis. Placing the pointer on the truncated data opens a tooltip that shows the complete data.
IMPORTANT: Measures portlets that are created on a DivePort portal with a Measure Factory license are not compatible with a portal with a standard license. However, measures portlets that are created on a DivePort portal with a standard license can work on a portal with a Measure Factory license if in the portaldb.json file, the portal info enable-legacy-portlets attribute is set to true. This setting also allows you to add new instances of measure portlets using the legacy portlet dialog box.
NOTE: Measures portlets display
Example:

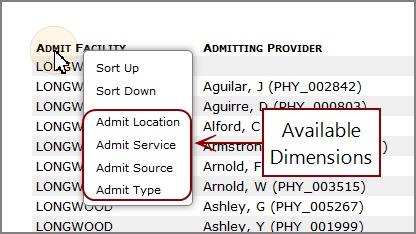
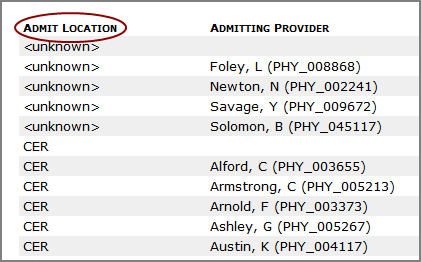
In this example, if a user selects Admit Location from the list, the portlet replaces the Admit Facility values column with Admit Location values.

TIP: If the page displays a chart portlet and a measure portlet, you can set a chart portlet option to synchronize the dimension that displays in the chart with the dimension that displays in the measure portlet. When this option is enabled, and the user switches dimensions on the measures portlet, the chart portlet also updates to show data for the new dimension. For more information, see Synchronizing Chart Portlets with Measures Portlets.
-
Measures portlets are limited to displaying 100,000 rows from a dive, cplan, cbase, or marker file.
-
Measure Factory measures portlets automatically filter the window using the union of the column time series filters.
NOTE: Measures portlets are limited to displaying 100,000 rows from a dive, cplan, cbase, or marker file.
See also:
- Adding a Measures Portlet
- Measures Portlet Options
- Adding an Indicator Column to a Portlet
- Stacking Columns in a Measures Portlet
Mentioned in: