Data Area Code Samples
Data areas can contain six different types of data pages: report, ad hoc, cross, dive, overview, and central.
 Report Page Code Sample
Here is an  example of a report page in DiveTab.
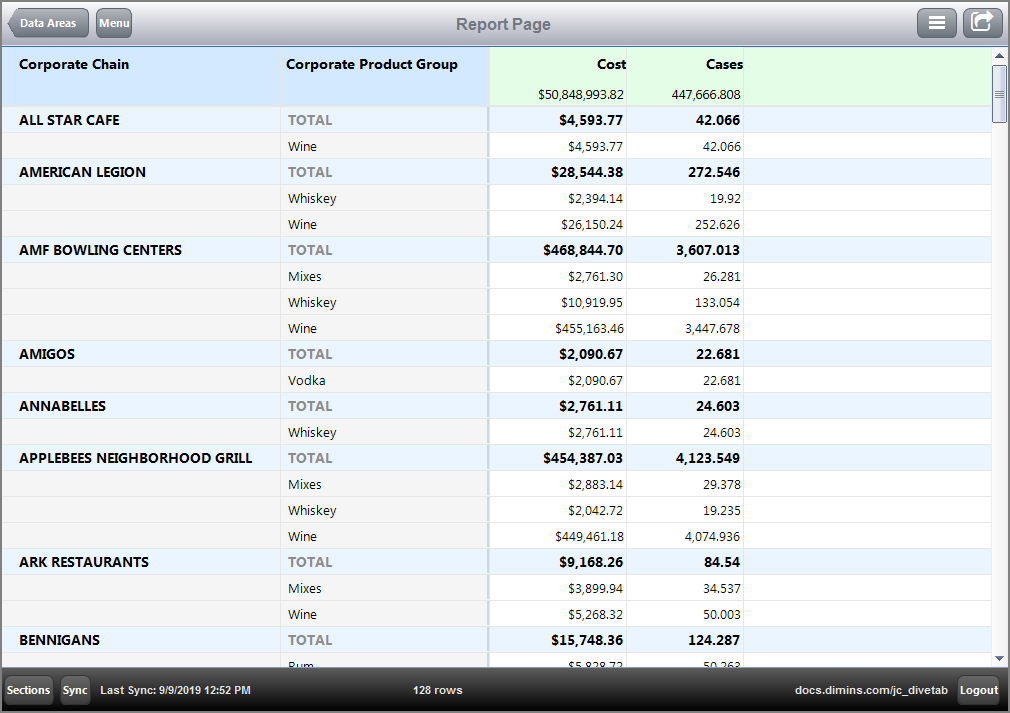
Here is how the  report page appears in the code.
divetab version = "0.0" {
  data-area id = "data-area-1" {
    title "Data Area Examples"
    icon "/divetab/images/menu icons/49.png"

    sections {
      report-page {
        title "Report Page"
        cplan "/cplans/basic_101.cplan"

        dimension "Corporate Chain"
        dimension "Corporate Product Group"

        text column = "Cost" {
          value-format "$#,###.00"
        } text column = "Cases"
      }
    }
  }
}
For more information, see About Report Page Type.
 Cross Page Code Sample
Here is an  example of a cross page in DiveTab.

Here is how the  cross page appears in the code.
divetab version = "0.0" {
  data-area id = "data-area-1" {
    title "Data Area Examples"
    icon "/divetab/images/menu icons/49.png"

    sections {
      cross-page {
        title "Cross Page"
        cplan "/cplans/basic_102.cplan"

        quickview-set {
          cplan "/cplans/basic_102.cplan"
          dimension-quickview "Premise"
          dimension-quickview "Resp Team"
        }
        dimension "Premise"
        cross-dimension "Resp Team"

        text column = "Cases" {
          value-format "#,###.00"
        }
        text column = "Cost" {
          value-format "$#,###.00"
        }
        text column = "Net Sales" {
          value-format "$#,###.00"
        }
      }
    }
  }
}
For more information, see About Cross Page Type.
 Dive Page Code Sample
Here is an  example of a dive page in DiveTab.
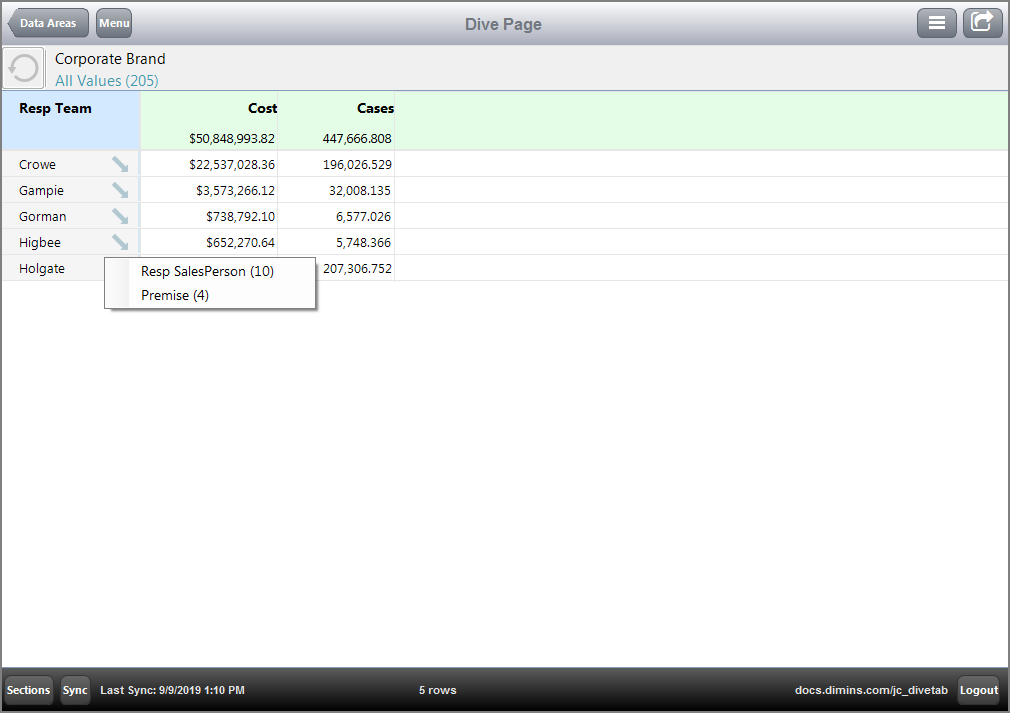
Here is how the  dive page appears in the code.
divetab version = "0.0" {
  data-area id = "data-area-1" {
    title "Data Area Examples"
    icon "/divetab/images/menu icons/49.png"
    sections {
      dive-page {
        title "Dive Page"
        cplan "/cplans/basic_102.cplan"

        dimension "Resp Team"

        dimcount-dimension "Resp SalesPerson"
        dimcount-dimension "Premise"

        quickview-dimension "Corporate Brand"
        available-dimension "Corporate Product Group"

        text column = "Cost" {
          value-format "$#,###.00"
        }
        text column = "Cases"
      }
    }
  }
}
NOTES:
-
QuickViews can be included using the quickview-dimension or quickview-set attributes.
-
A QuickView set can use a different cPlan.
-
Available dimensions appear as options for QuickViews in the Edit QuickViews dialog box.
For more information, see About Dive Page Type.
 Ad Hoc Page Code Sample
Here is an  example of an ad hoc page in DiveTab, with Dive Dimensions expanded.

Here is how the  ad hoc page appears in the code.
divetab version = "0.0" {
  data-area id = "data-area-1" {
    title "Data Area Examples"
    icon "/divetab/images/menu icons/49.png"

    sections {
      ad-hoc-page {
        title "Ad Hoc Page"
        cplan "/cplans/basic_101.cplan"

        dimension "Vendor"

        dimcount-dimension "Customer County"
        dimcount-dimension "Product Name"
        dimcount-dimension "Corporate Brand"

        quickview-dimension "Customer"
        quickview-dimension "Premise"

        available-dimension "Resp SalesPerson"
        available-dimension "County"

        text column = "Cases" {
          value-format "#,###.00"
        }
        text column = "Cost" {
          value-format "$#,###.00"
        } text column = "Net Sales" {
          value-format "$#,###.00"
        }
      }
    }
  }
}
For more information, see About Ad Hoc Page Type.
 Overview Page Code Sample
Here is an  example of an overview page in DiveTab.
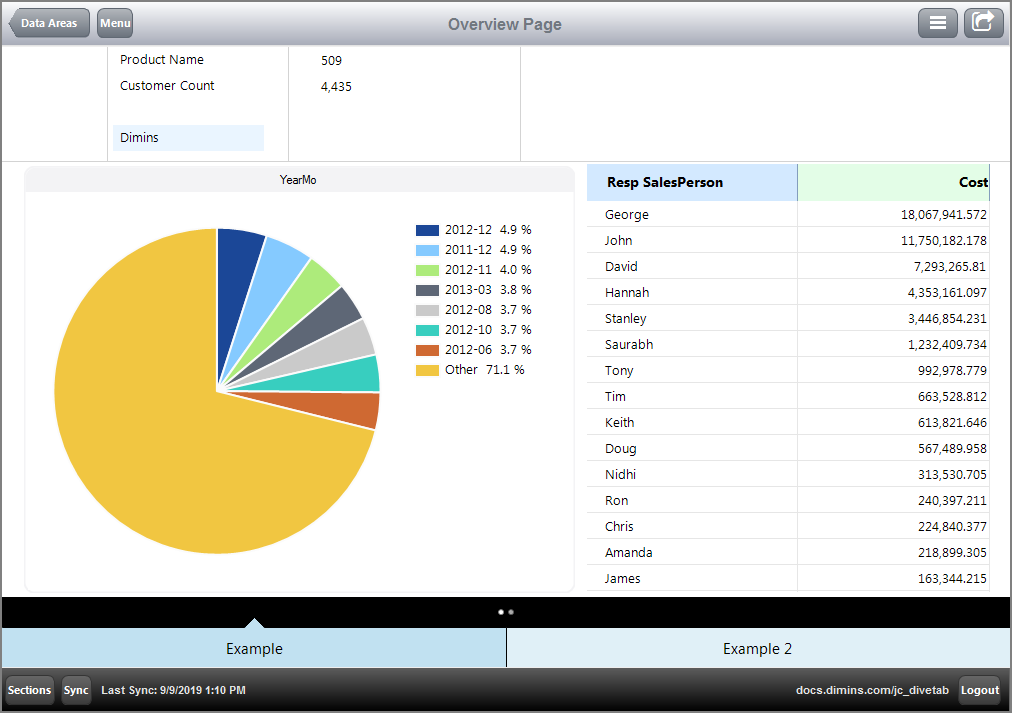
NOTE: The elements block can be used within the page type block or the definition block in the data-area block.
TIP: The cPlan used by an element can be different from the one used by the page. If no cplan tag is in use for the element, it uses the page cPlan automatically.
Here is how the  overview page appears in the code.
divetab version = "0.0" {
  data-area id = "data-area-1" {
    title "Data Area Examples"
    icon "/divetab/images/menu icons/49.png"

    sections {
      overview-page {
        title "Overview Page"
        cplan "/cplans/basic_timeseries.cplan"

        tab "Example" {
          screen {
            layout {
              vsplit {

                hsplit percent = 21 {
                  spacer percent = 10
                  line percent = 1
                  element id = "gddimensions" percent = 15
                  line percent = 5
                  element id = "gddimcount" percent = 20
                  line percent = 1
                  spacer percent = 10
                }
                line percent = 1
                hsplit percent = 80 {
                  spacer percent = 2
                  element id = "yearmo" percent = 55
                  spacer percent = 1
                  element id = "tb-salesperson" percent = 40
                  spacer percent = 2
                }
              }
            }
          }
          screen {
            layout {
              vsplit {

                hsplit percent = 30 {
                  spacer percent = 10
                  line percent = 1
                  element id = "gddimensions" percent = 20
                  line percent = 1
                  element id = "gddimcount"
                }
                line percent = 1
                hsplit percent = 60 {
                  element id = "yearmo" percent = 90
                }
              }
            }
          }
        }
        tab "Example 2" {
          screen {
            layout {
              vsplit {

                hsplit percent = 30 {
                  spacer percent = 10
                  line percent = 1
                  element id = "gddimensions" percent = 20
                  line percent = 1
                  element id = "gddimcount"
                }
                line percent = 1
                hsplit percent = 60 {
                  element id = "yearmo" percent = 90
                }
              }
            }
          }
        }
        elements {

          grid id = "gddimensions" {
            row "Product Name"
            row "Customer Count"
            row
            row {
              text "Dimins" {
                link {
                  web-page "www.dimins.com"
                }
              }
            }
          }
          grid id = "gddimcount" {
            row {
              text column = "Product Name Count" {
                justification "left"
              }
            }
            row {
              text column = "Customer Count" {
                justification "left"
              }
            }
          }
          pie-chart id = "yearmo" {
            title "YearMo"
            dimension "Posting Period"
            column column = "Cases"
          }
          table id = "tb-salesperson" {
            dimension "Resp SalesPerson"
            text column = "Cost"
            first 15
            sort-column "Cost"
          }
        }
      }
    }
  }
}
For more information, see About Overview Page Type.
 Central Page Code Sample
Here is an  example of a report page that leads to a central page.
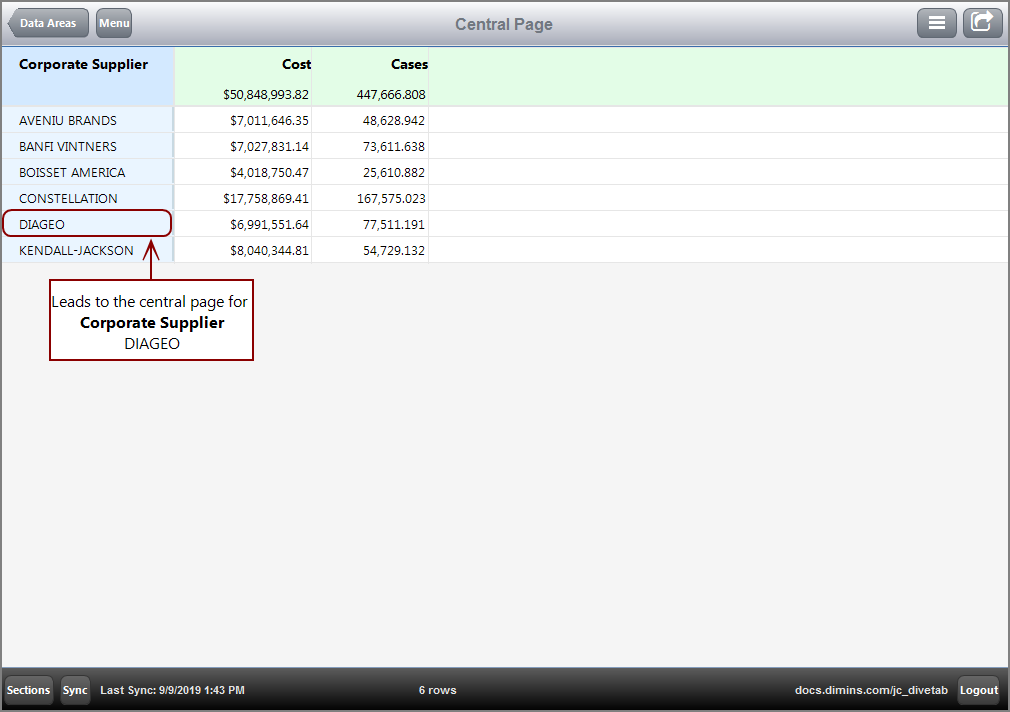
Here is how the  report page appears in the code.
      report-page {
        title "Central Page"
        cplan "/cplans/basic_timeseries.cplan"

        dimension "Corporate Supplier"
        text column = "Cost" {
          value-format "$#,###.00"
        }
        text column = "Cases"
      }
Here is the  central page for dimension Corporate Supplier DIAGEO.
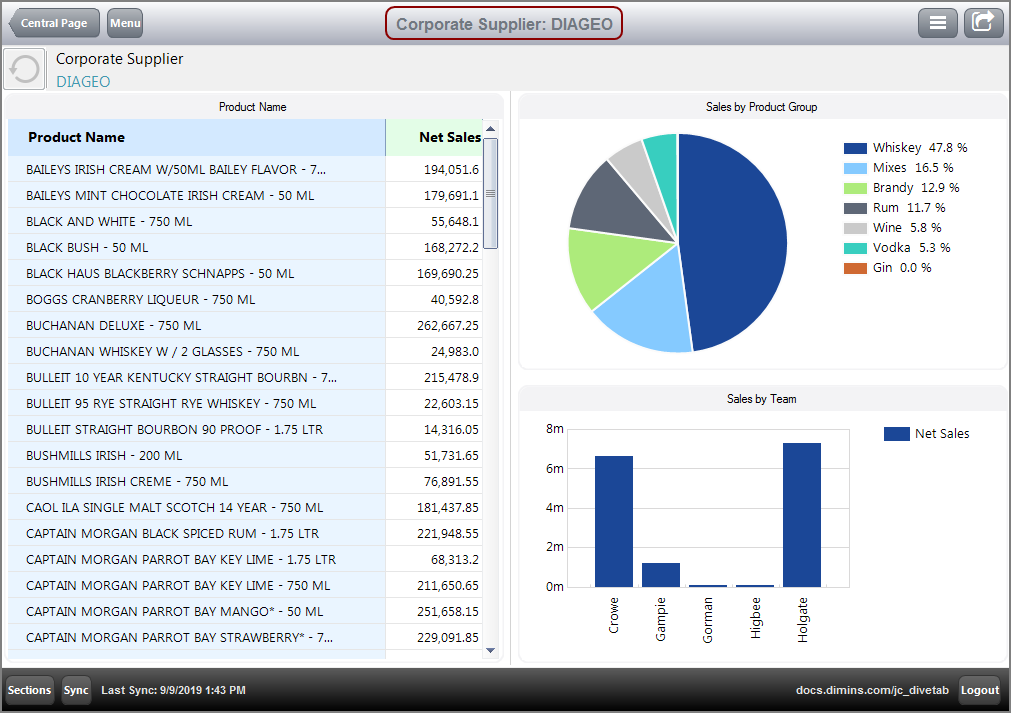
Here is how the  central page appears in the code.
      central-page {
        cplan "/cplans/basic_timeseries.cplan"

        dimension "Corporate Supplier"
        dimension "Product Name"

        parameter "Corporate Supplier"
        parameter "Product Name"

        tab {
          screen {
            layout {
              hsplit {

                vsplit percent = 50 {
                  element id = "tb-product"
                }
                line percent = 1
                hsplit percent = 49 {
                  element id = "pc-products" percent = 49
                  spacer percent = 2
                  element id = "br-teamsales" percent = 49
                }
              }
            }
          }
        }

        elements {

          table id = "tb-product" {
            title "Product Name"
            dimension "Product Name"
            text column "Net Sales"
          }

          pie-chart id = "pc-products"
            text column = "Sales by Product Group" {
            dimension "Corporate Product Group"
            column column = "Net Sales"
          }

          bar-chart id = "br-teamsales" {
            title "Sales by Team"
            dimension "Resp Team"
            bar column = "Net Sales"
          }
        }
      }
For more information, see About Central Page Type.
See also:
![]() example of a report page in DiveTab
example of a report page in DiveTab![]() report page appears in the code.
report page appears in the code.![]() example of a cross page in DiveTab.
example of a cross page in DiveTab.![]() cross page appears in the code.
cross page appears in the code.![]() example of a dive page in DiveTab.
example of a dive page in DiveTab.![]() dive page appears in the code.
dive page appears in the code.![]() example of an ad hoc page in DiveTab, with Dive Dimensions expanded.
example of an ad hoc page in DiveTab, with Dive Dimensions expanded.![]() ad hoc page appears in the code.
ad hoc page appears in the code.![]() example of an overview page in DiveTab.
example of an overview page in DiveTab.![]() overview page appears in the code.
overview page appears in the code.![]() example of a report page that leads to a central page.
example of a report page that leads to a central page.![]() report page appears in the code.
report page appears in the code.![]() central page for dimension Corporate Supplier DIAGEO.
central page for dimension Corporate Supplier DIAGEO.![]() central page appears in the code.
central page appears in the code.


