The DiveTab report page (formerly called a list page) reads data from a cPlan and presents that data in a predefined tabular format. Dimension values appear in the leftmost columns, with numeric summary values or information fields to the right. When multiple dimensions are defined, the effect is a multi-tabbing of information. The context menu for dimensions includes a find option; a single dimension also includes a sort option. Summary columns have a default context menu that supports sorting, ranking, or displaying a percentage or graph. If you define hidden columns, the context menu includes the option to expand and collapse those hidden columns.
The following screen captures show example report pages with different number of dimensions and summaries, with and without the context menus, and example expanded summary columns.
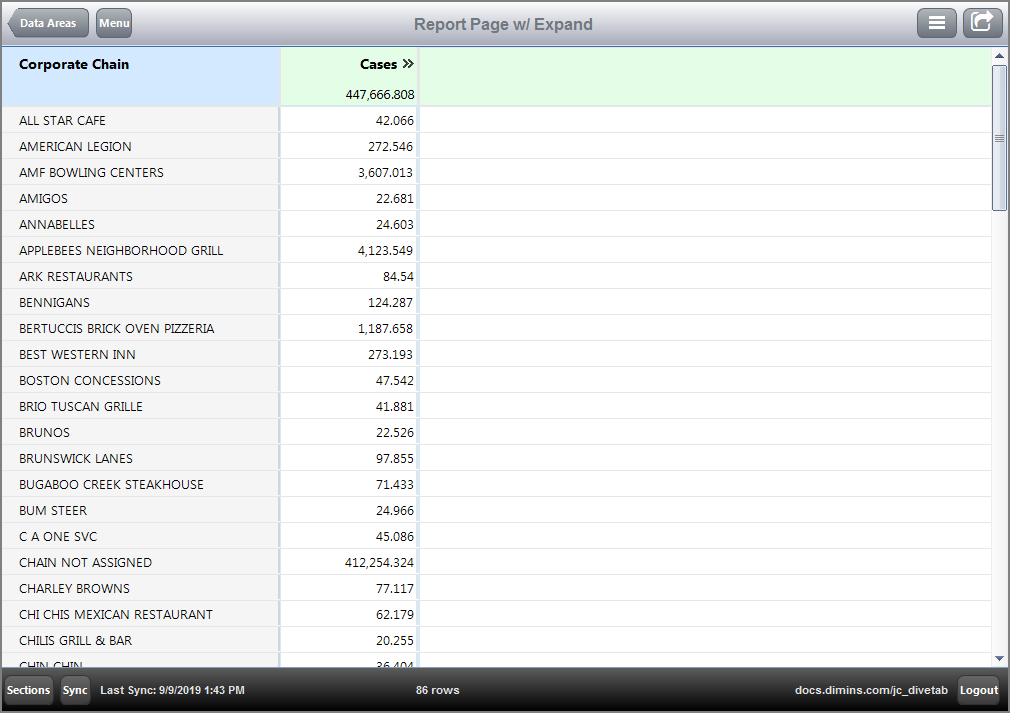
Here is ![]() an example of a report page with one dimension.
an example of a report page with one dimension.
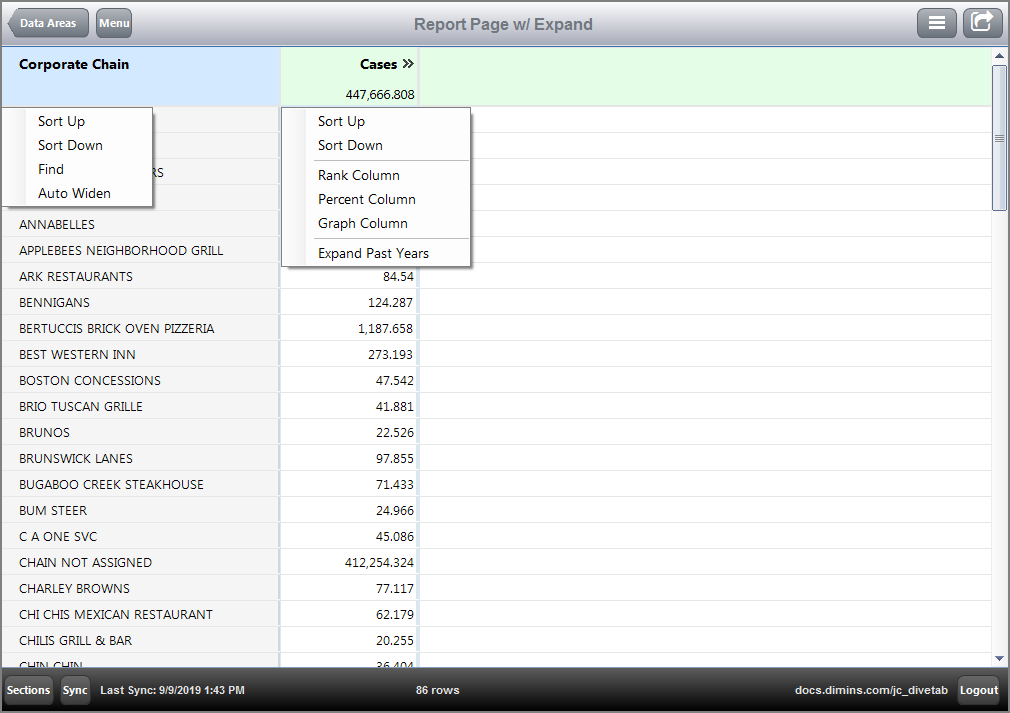
Here is the same ![]() report page showing the context menus for the dimension and summary.
report page showing the context menus for the dimension and summary.
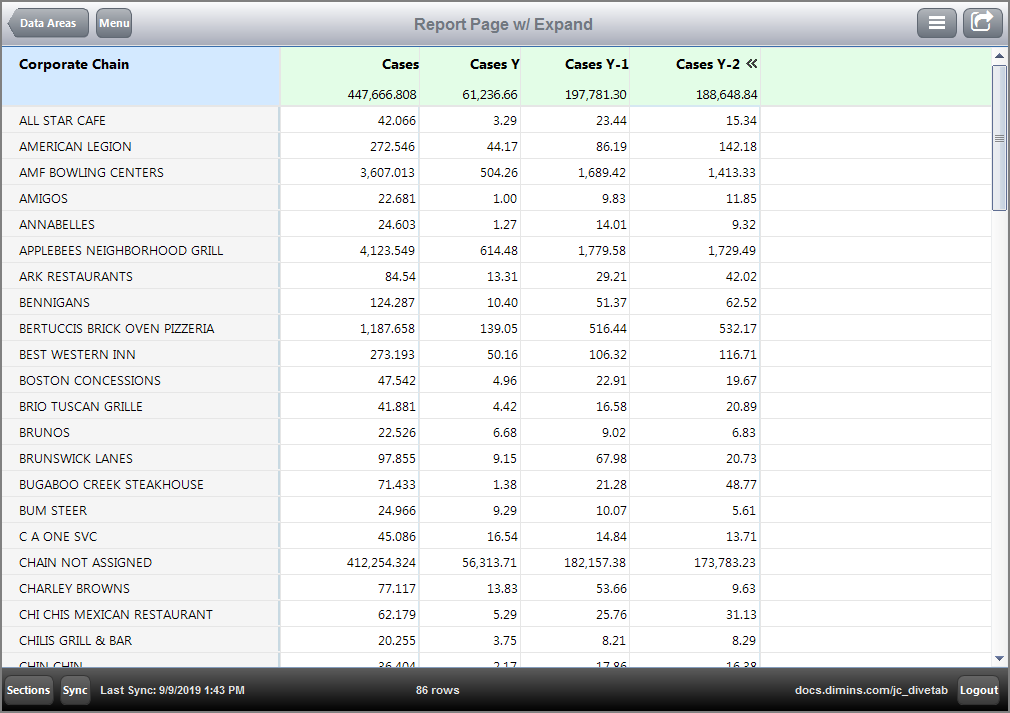
Here is ![]() an example of a report page with expanded summary columns for Past Years.
an example of a report page with expanded summary columns for Past Years.
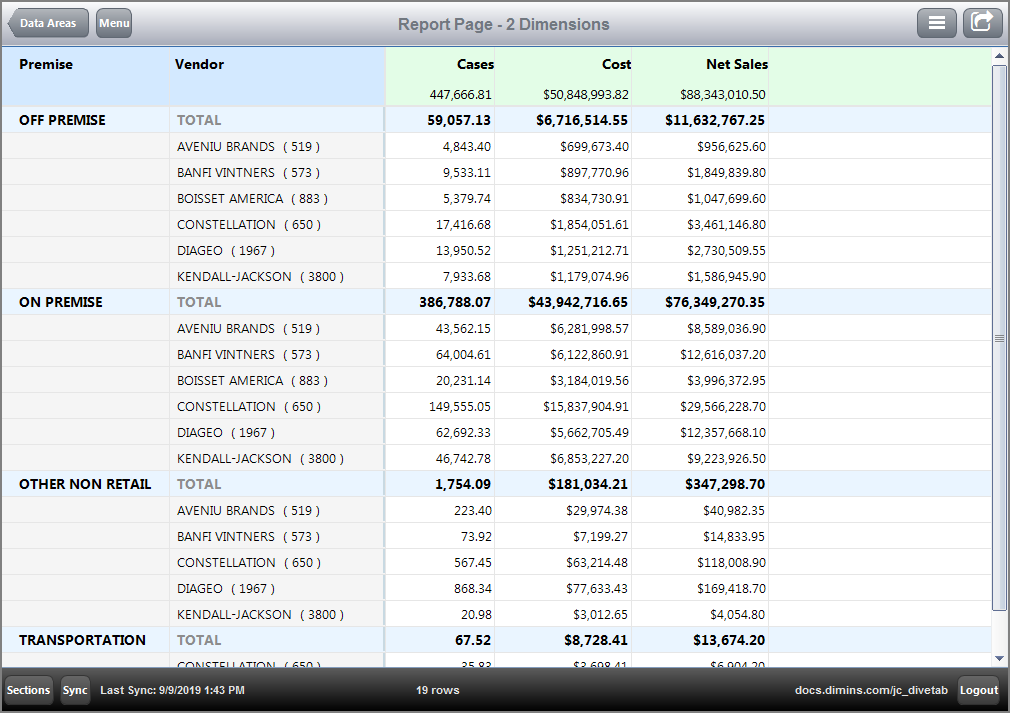
Here is ![]() an example of a report page with two dimensions and three summaries.
an example of a report page with two dimensions and three summaries.
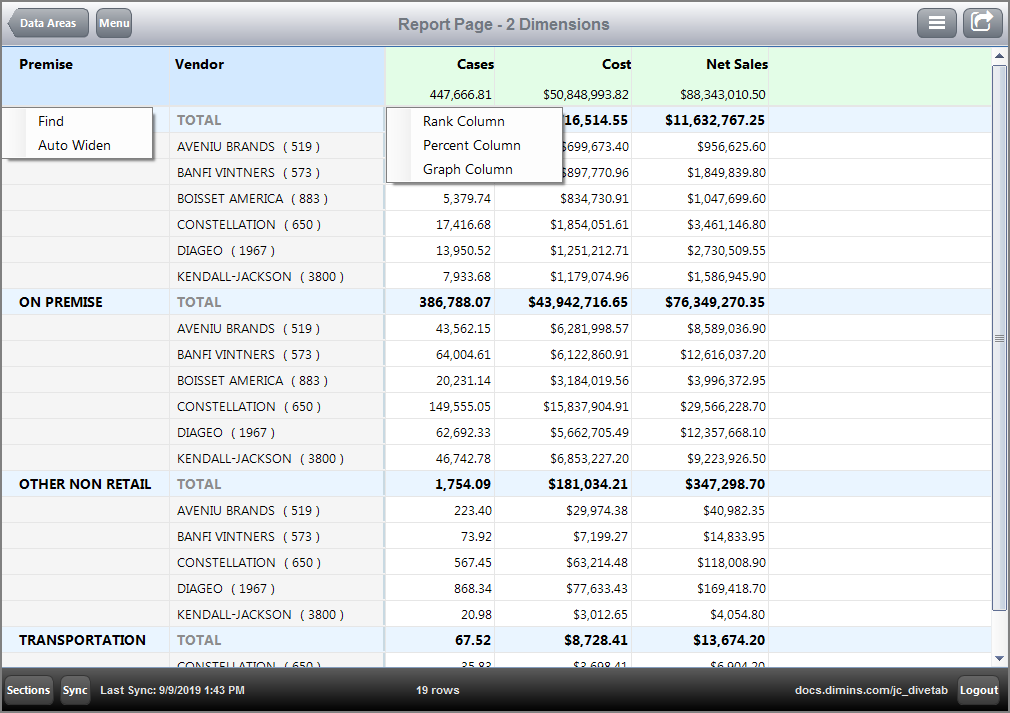
Here is the same ![]() report page showing context menus for a dimension and summary column.
report page showing context menus for a dimension and summary column.
Notice that summaries cannot sort when more than one dimension is in use.
See also:
