Indicator Type s
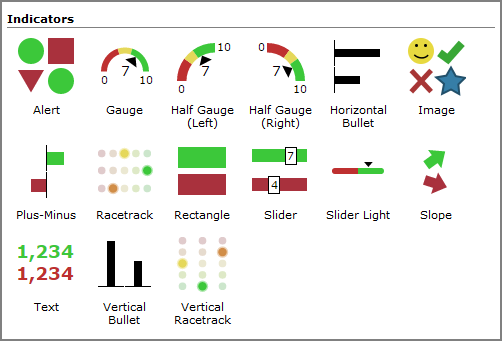
| Indicator Type and Appearance | Description |
|---|---|
|
Alert
|
A single shape that changes color based on whether the value is above or below specified thresholds. You can choose a circle, square, triangle, or arrow shape for the alert. Use alerts to provide context to data on a tabular display or as free standing portlets. NOTE: The arrow shape is available with the standard license only. |
|
|
A bar chart containing threshold and target values. Use bullets to display summaries that have multiple meaningful values. For example, trends over time, relative standing within a group, or a metric with multiple targets. NOTE: Available with a standard license only. |
|
|
An arc and a knob with a needle that indicates where a value falls within a set of performance thresholds. Use dials where three ranges are needed. For example, unacceptable, acceptable, exceptional. Because the performance color is displayed prominently on the knob, you can use dials in small spaces on a dashboard. NOTE: Available with a standard license only. |
|
|
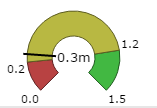
An arc with red, yellow, green performance thresholds and a needle or arrow to indicate in which threshold the value falls. Use gauges when three ranges are needed. For example, unacceptable, acceptable, and exceptional, and you want to use a scale other than the threshold values. |
|
Half Gauge (Left or Right)
|
An arc with red, yellow, green performance thresholds and an arrow to indicate in which threshold the value falls. NOTE: Available with a Measure Factory license only. |
|
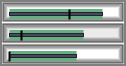
Horizontal Bullet
|
A horizontal bar chart containing threshold and target values. Use bullets to display summaries that have multiple meaningful values. For example, trends over time, relative standing within a group, or a metric with multiple targets. NOTE: Available with a Measure Factory license only. |
|
Image
|
A designated set of images you can use to display up to four thresholds. Link each range to a different image. DivePort provides a built-in image set, and you can upload custom image sets. |
|
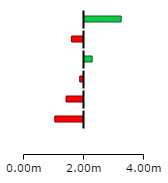
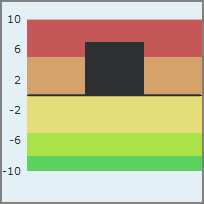
Plus-Minus
|
A horizontal bar chart that displays values to the left (below) and to the right (above) of a designated baseline. Use plus-minus indicators to display values with a single baseline where the amount by which you exceed or fail to meet the value is important. |
|
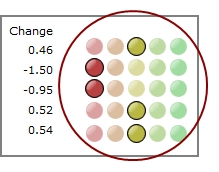
Racetrack
|
A set of two to five colored circles indicating where a value falls within a set of threshold ranges. Use racetrack indicators to provide context to the values displayed. |
|
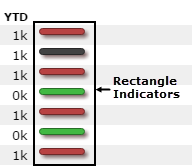
Rectangle
|
A single rectangular shape with customizable visual elements that change based on various thresholds. Use rectangles when you want to display thresholds for different summary values at the same time. |
|
Slider
|
A box containing the value that is displayed on a left-to-right track, relative to the numbers at each end of the track. Use the slider when you want to indicate the value position in a range to provide context to a number of values. |
|
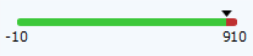
Slider Light
|
A thick line with an arrow that shows the data value relative to thresholds. NOTE: Available with a Measure Factory license only. |
|
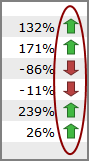
Slope
|
A right-pointing arrow that changes direction based on changes over time, with no change pointing right and all other values pointing up or down at an angle (depending on whether the change in value is positive or negative). Use the slope when the direction of change over time is the only element that matters. |
|
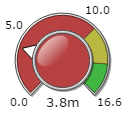
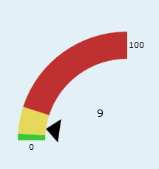
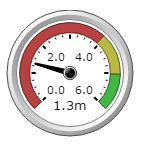
Speedometer
|
A gauge stylized to look like a speedometer with performance zones and a needle to indicate in which zone the value falls. Use the speedometer to draw attention to a significant KPI. NOTE: Available with a standard license only. |
|
Text
|
An alphanumeric string that is colored to indicate its value's relationship to the thresholds. Use the text indicator to indicate a value's acceptability without added graphics. NOTE: No data and null values appear as "- -" |
|
Vertical Bullet
|
A vertical bar chart containing threshold and target values. Use bullets to display summaries that have multiple meaningful values. For example, trends over time, relative standing within a group, or a metric with multiple targets. NOTE: Available with a Measure Factory license only. |
|
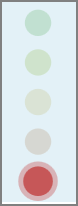
Vertical Racetrack
|
A set of two to five lights indicating where a value falls within a set of threshold ranges. Use racetracks to provide context to the data displayed. NOTE: Available with a Measure Factory license only. |


See also:
- Adding an Indicator Portlet to a Page
- Adding an Indicator Column to a Portlet
- Indicator Portlet Options - Measure Factory License
- Indicator Portlet Options - Standard License