What is a Tab Block?
Tabs organize data onto different screens when defining overview and central data pages. When there is more than one tab, they appear on the bottom of the screen. DiveTab users can select each tab to present different information.
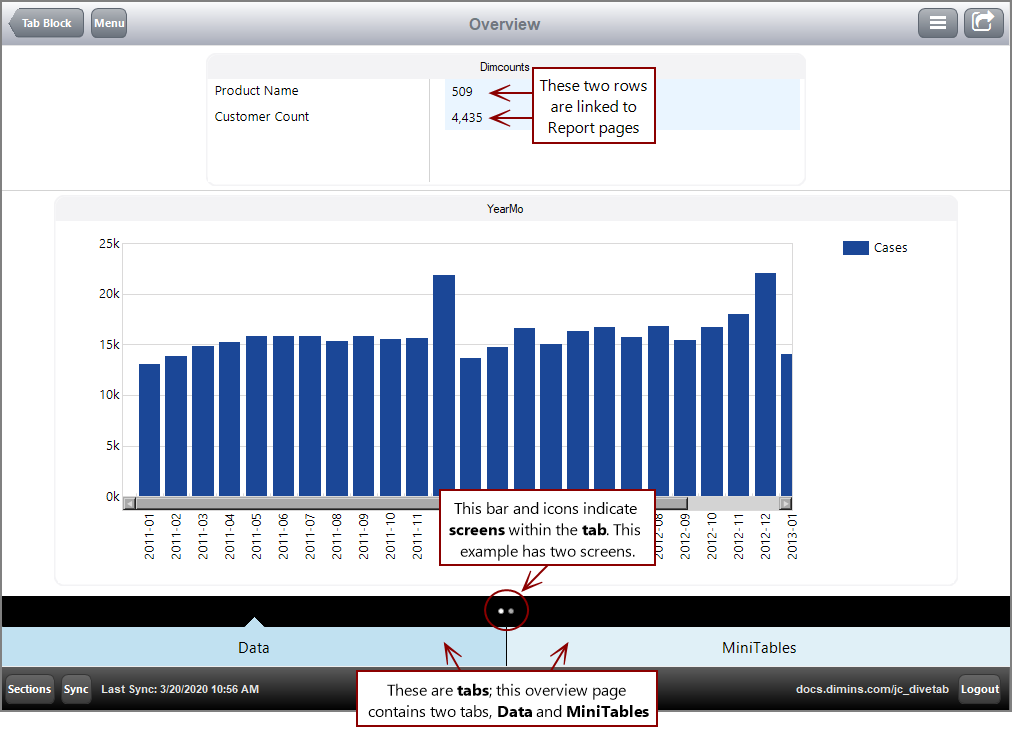
Here is an  example of an overview page that uses tabs. There are two tabs, and the Data tab contains two screens.

Notice that the Data tab is a darker shade of blue; this indicates that it is selected and being viewed. The circles in the black bar above the tabs indicate screens within the Data tab; the lighter shaded circle indicates the screen that is selected and being viewed.
You can include multiple tabs and multiple screens for each tab. This allows for more ways to include and group information.
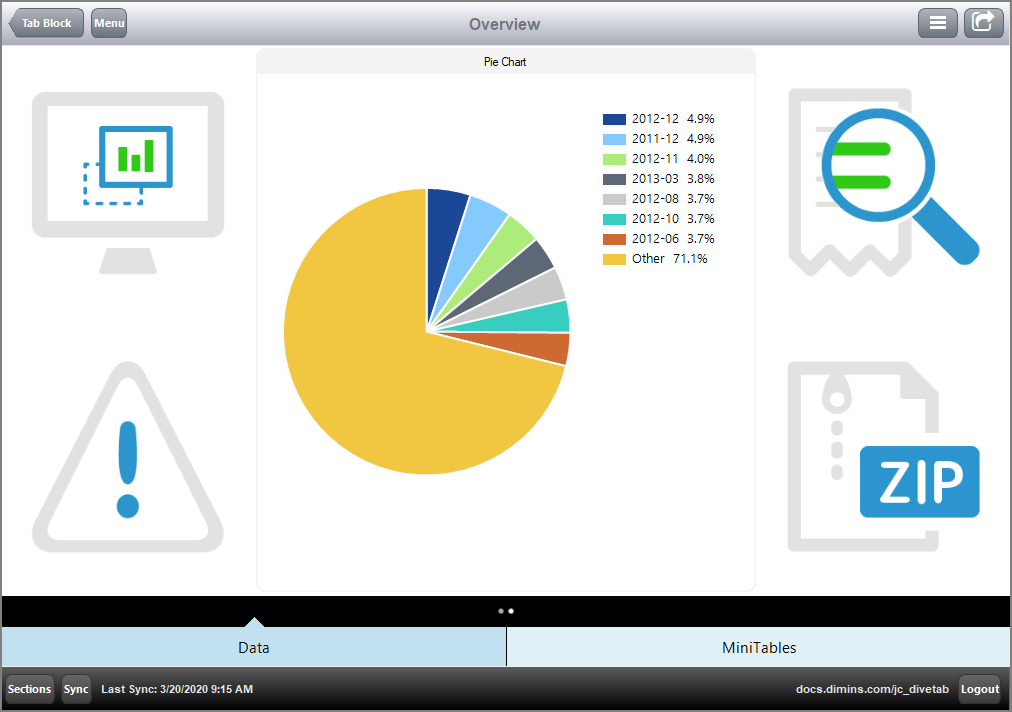
Here is the  second screen for the Data tab.

Notice that the circle on the right is now lighter than the circle on the left; this indicates that the second screen is being viewed.
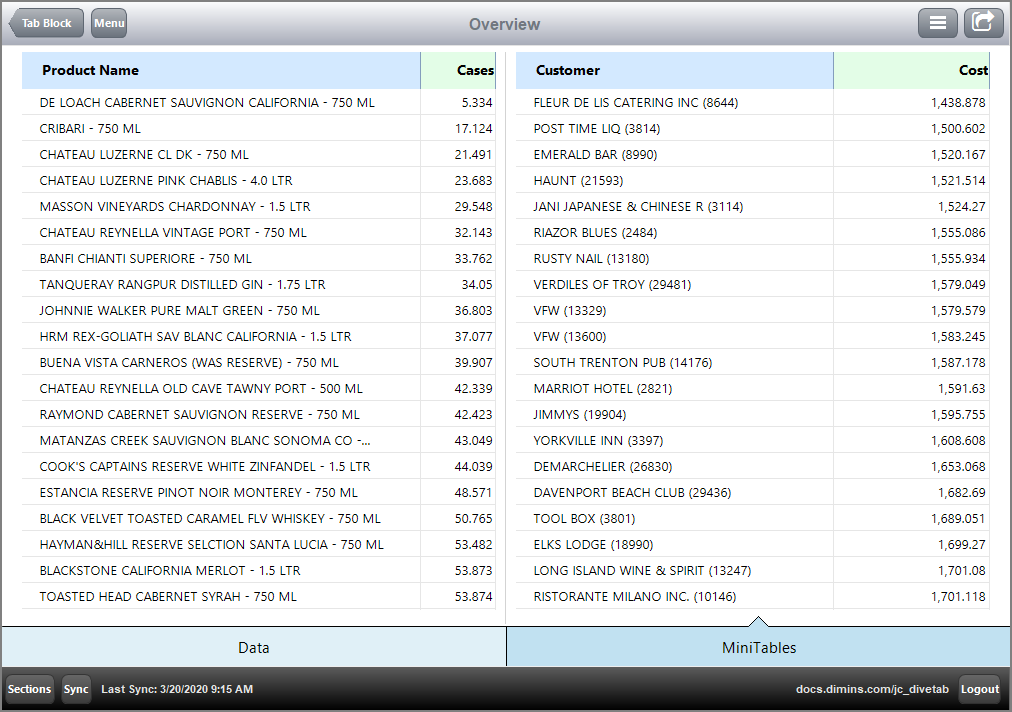
Here is the  second tab, MiniTables, which includes two tables on the same screen.

NOTE: This tab contains one screen, so the screen bar does not appear. Likewise, when a single tab is used, the tab bar does not appear.
Here is how this  example of an overview page looks in the script.
divetab version = "0.0" {

  definitions {
    elements {

      grid id = "gddimensions" {
        row "Product Name"
        row "Customer Count"
      }

      grid id = "gddimcount" {
        row {
          text column = "Product Name Count" {
            justification "left"
            link {
              page id = "rp-product"
            }
          }
        }
        row {
          text column = "Customer Count" {
            justification "left"
            link {
              page id = "rp-customer"
            }
          }
        }
      }

      bar-chart id = "br-yearmo" {
        title "YearMo"
        dimension "Posting Period"
        bar column = "Cases"
      }

      table id = "tb-product" {
        dimension "Product Name"
        text column = "Cases"
        sort-column "Cases" reverse = true
        first 20
      }

      table id = "tb-customer" {
        dimension "Customer"
        text column = "Cost"
        sort-column "Cost" reverse = true
        first 20
      }

      pie-chart id = "pc-yearmo" {
        cplan "/cplans/basic_101.cplan"
        title "Pie Chart"

        dimension "Posting Period"
        column column = "Cases"
      }
    }
  }

  data-area id = "NY Data" {
    title "Tabs"
    icon "/divetab/images/menu icons/28"

    sections {

      overview-page {

        title "Overview"
        cplan "/cplans/basic_timeseries.cplan"

        tab "Data" {
          screen {
            layout {
              vsplit {
                spacer percent = 1
                hsplit percent = 25 {
                  spacer percent = 20
                  box percent = 60 {
                    title "Dimcounts"
                    hsplit {
                      element id = "gddimensions" percent = 35
                      line percent = 5
                      element id = "gddimcount" percent = 60
                    }
                }
                line percent = 1
                hsplit percent = 72 {
                  spacer percent = 5
                  element id = "br-yearmo" percent = 90
                  spacer percent = 5
                }
                spacer percent = 1
              }
            }
          }

          screen {
            layout {
              hsplit {
                vsplit percent = 25 {
                  image percent = 50 {
                    path "/divetab/images/menu icons/23.png"
                  }
                  image percent = 50 {
                    path "/divetab/images/menu icons/34.png"
                  }
                }
                vsplit percent = 50 {
                  element id = "pc-yearmo"
                }

                vsplit percent = 25 {
                  image percent = 50 {
                    path "/divetab/images/menu icons/46.png"
                  }
                  image percent = 50 {
                    path "/divetab/images/menu icons/56.png"
                  }
                }
              }
            }
          }
        }

        tab "MiniTables" {

          screen {

            layout {
              vsplit {
                spacer percent = 1
                hsplit percent = 99 {
                  spacer percent = 2
                  element id = "tb-product" percent = 47
                  line percent = 2
                  element id = "tb-customer" percent = 47
                  spacer percent = 2
                }
              }
            }
          }
        }
      }
    }
    pages {
      report-page id = "rp-customer" {
        title "Customer"
        cplan "/cplans/basic_timeseries.cplan"
        dimension "Customer"

        parameter "Customer"
        parameter "Product Name"

        text column = "Cases"
        text column = "Cost"
      }

      report-page id = "rp-product" {
        title "Product"
        cplan "/cplans/basic_timeseries.cplan"
        dimension "Product Name"

        parameter "Customer"
        parameter "Product Name"

        text column = "Cases"
        text column = "Cost"
      }
    }
  }
}
See also:
![]() example of an overview page that uses tabs. There are two tabs, and the Data tab contains two screens.
example of an overview page that uses tabs. There are two tabs, and the Data tab contains two screens.![]() second screen for the Data tab.
second screen for the Data tab.![]() second tab, MiniTables, which includes two tables on the same screen.
second tab, MiniTables, which includes two tables on the same screen.![]() example of an overview page looks in the script.
example of an overview page looks in the script.

