Tab Code Sample
Here is a  code sample of an overview page that uses three tabs.
divetab version = "0.0" {

  definitions {
    elements {
      grid id = "gddimensions" {
        row "Product Name"
        row "Customer Count"
        row
        row "Resp Team Count"
        row "Resp SalesPerson Count"
      }

      grid id = "gddimcount" {
        row {
          text column = "Product Name Count"{
            justification "left"
            link {
              page id = "rp-product"
            }
          }
        }
        row {
          text column = "Customer Count" {
            justification "left"
            link {
              page id = "rp-customer"
            }
          }
        }
        row
        row {
          text column = "Resp Team Count" {
            justification "left"
          }
        }
        row {
          text column = "Resp SalesPerson Count" {
            justification "left"
          }
        }
      }

      bar-chart id = "br-respteam" {
        title "Bar Chart"
        dimension "Resp Team"
        bar column = "Cost"
      }

      hbar-chart id = "hbr-respteam" {
        dimension "Resp Team"
        bar column = "Cost"
      }

      line-chart id = "ln-respteam" {
        title "Line Chart"
        dimension "Resp Team"
        line column = "Cost"
      }

      pie-chart id = "pc-respteam" {
        title "Pie Chart"
        dimension "Resp Team"
        column column = "Cost"
      }

      bar-chart id = "br-yearmo" {
        title "YearMo"
        dimension "Posting Period"
        bar column = "Cases"
      }

      table id = "tb-product" {
        dimension "Product Name"
        text column = "Cost"
        text column = "Cases"
        sort-column "Cases" reverse = true
        first 20
      }

      table id = "tb-customer" {
        dimension "Customer"
        text column = "Cost"
        text column = "Cases"
        sort-column "Cases" reverse = true
        first 20
      }
    }
  }

  data-area id = "NY Data" {
    title "Tab Code Sample"
    icon "/divetab/images/menu icons/14.png"

    sections {

      overview-page {

        title "Overview"
        cplan "/cplans/basic_timeseries.cplan"

        tab "Overview" {
          screen {
            layout {
              vsplit {
                spacer percent = 2
                hsplit percent = 28 {
                  spacer percent = 30
                  box percent = 40 {
                    title "Dimcounts"
                    hsplit {
                      element id = "gddimensions" percent = 50
                      line percent = 1
                      element id = "gddimcount" percent = 49
                    }
                  }
                  spacer percent = 30
                }
                line percent = 2
                hsplit percent = 68 {
                  spacer percent = 5
                  element id = "br-yearmo" percent = 90
                  spacer percent = 5
                }
              spacer percent = 2
              }
            }
          }
        }

        tab "Charts" {
          screen {
            layout {
              vsplit percent = 50 {

                hsplit percent = 50 {
                  vsplit percent = 50 {
                    element id = "br-respteam"
                  }
                  vsplit percent = 50 {
                    element id = "ln-respteam"
                  }
                }

                hsplit percent = 50 {
                  vsplit percent = 50 {
                    box {
                      title "H Bar"
                      element id = "hbr-respteam"
                    }
                  }
                  vsplit percent = 50 {
                    element id = "pc-respteam"
                  }
                }
              }
            }
          }
        }

        tab "MiniTables" {
          screen {
            layout {
              vsplit {
                spacer percent = 2
                hsplit percent = 98 {
                  spacer percent = 2
                  element id = "tb-product" percent = 46
                  line percent = 4
                  element id = "tb-customer" percent = 46
                  spacer percent = 2
                }
              }
            }
          }
        }
      }
    }

    pages {
      report-page id = "rp-customer" {
        title "Customer"
        cplan "/cplans/basic_timeseries.cplan"

        dimension "Customer"
        parameter "Customer"
        parameter "Product Name"

        text column = "Cases"
        text column = "Cost"
      }

      report-page id = "rp-product" {
        title "Product"
        cplan "/cplans/basic_timeseries.cplan"

        dimension "Product Name"
        parameter "Customer"
        parameter "Product Name"

        text column = "Cases"
        text column = "Cost"
      }
    }
  }
}
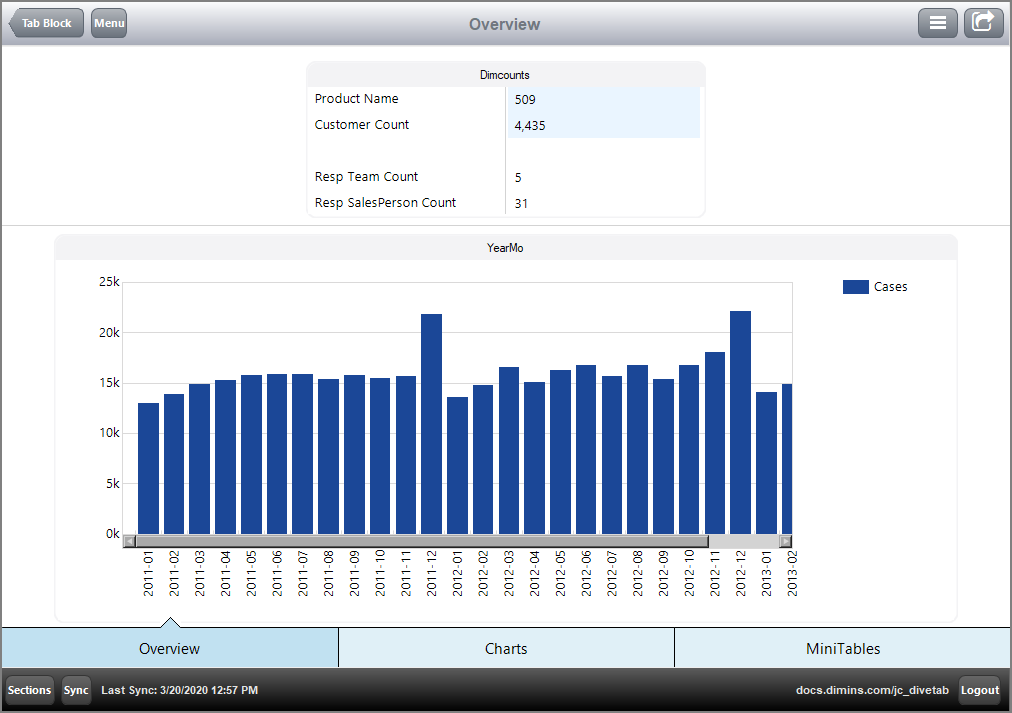
Here is the  result of the code in DiveTab, with the first tab, Overview, showing:

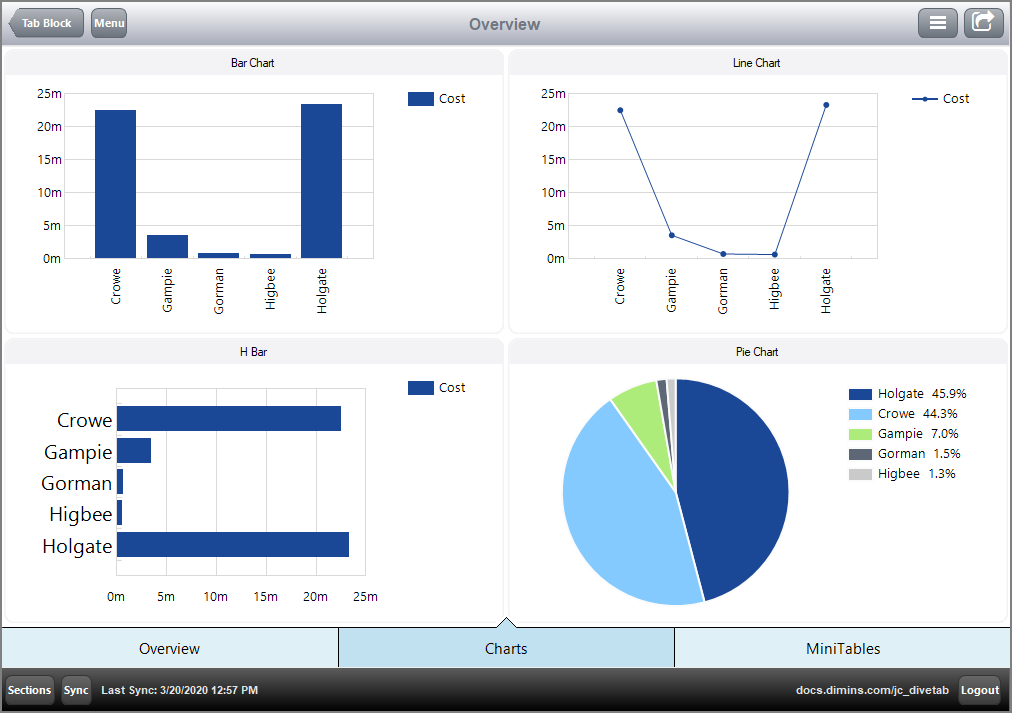
Here is the  overview page with the second tab, Charts, showing.

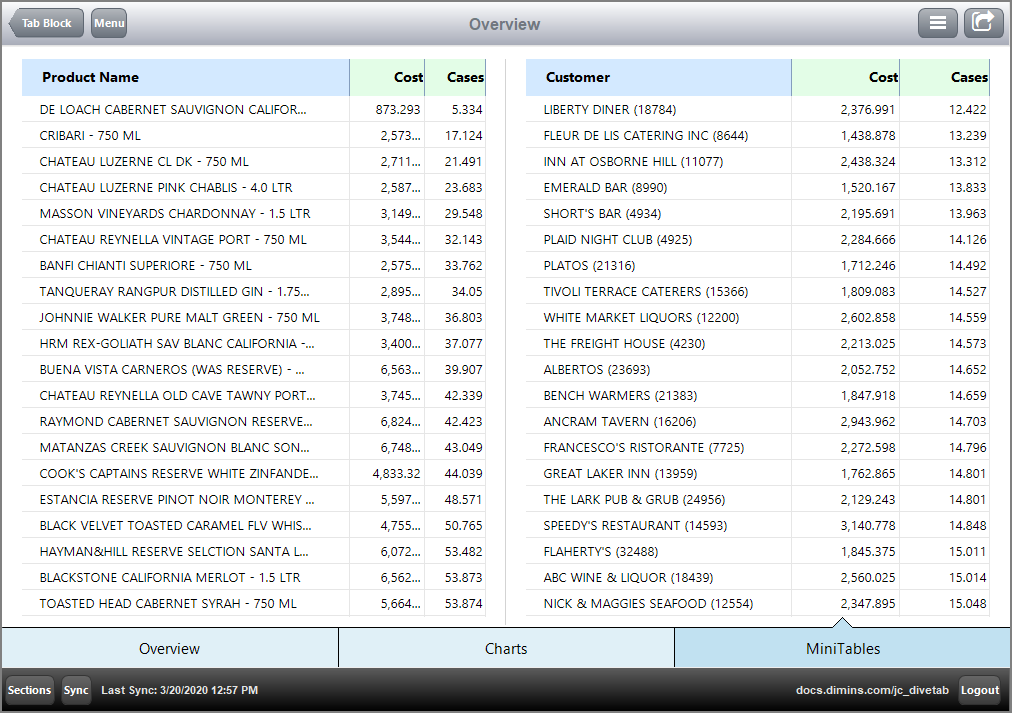
Here is the  overview page with the third tab, MiniTables, showing.

See also:
![]() code sample of an overview page that uses three tabs.
code sample of an overview page that uses three tabs.![]() result of the code in DiveTab, with the first tab, Overview, showing:
result of the code in DiveTab, with the first tab, Overview, showing:![]() overview page with the second tab, Charts, showing.
overview page with the second tab, Charts, showing.![]() overview page with the third tab, MiniTables, showing.
overview page with the third tab, MiniTables, showing.

