Definitions Code Sample
This sample code uses basic_101.cplan, which defines calculations for each dimension used in a grid for an overview page. The definitions block in this sample defines the rows and columns of the grid element and two charts that are then referenced in the data-area block.
Here is the  code used in the cPlan.
  cplan {
    cbase-input "/cbases/NY.cbase"

    calc "Posting Period Count" `dimcount("Posting Period")`
    calc "Corporate Product Sub Group Count" `dimcount("Corporate Product Sub Group")`
    calc "Corporate Product Group Count" `dimcount("Corporate Product Group")`
    calc "Corporate Brand Count" `dimcount("Corporate Brand")`
    calc "Resp Team Count" `dimcount("Resp Team")`
    calc "Resp SalesPerson Count" `dimcount("Resp SalesPerson")`
  }
Here is the  code for a grid used by the overview page. In the complete code, this elements block is contained within the definitions block at the top of the script, and the tab block is contained within the data area.
  elements {
    grid id = "grid_labels" {
      row "Posting Period"
      row
      row "Corporate Product Group"
      row "Corporate Product Sub Group"
      row "Corporate Brand"
      row
      row "Resp Team"
      row "Resp SalesPerson"
    }

    grid id = "grid_columns" {
      row {
        text column = "Posting Period Count" {
          justification "left"
        }
      }
      row
      row {
        text column = "Corporate Product Group Count" {
          justification "left"
        }
      }
      row {
        text column = "Corporate Product Sub Group Count" {
          justification "left"
        }
      }
      row {
        text column = "Corporate Brand Count" {
          justification "left"
        }
      }
      row
      row {
        text column = "Resp Team Count" {
          justification "left"
        }
      }
      row {
        text column = "Resp SalesPerson Count" {
          justification "left"
        }
      }
    }
  }
  ...
  tab "Sales" {
    screen {
      layout {
        vsplit {

          hsplit percent = 40 {
            spacer percent = 3
            element id = "grid_labels" percent = 20
            line percent = 2
            element id = "grid_columns" percent = 10
            line percent = 2
          }
          line percent = 1
        }
      }
    }
  }
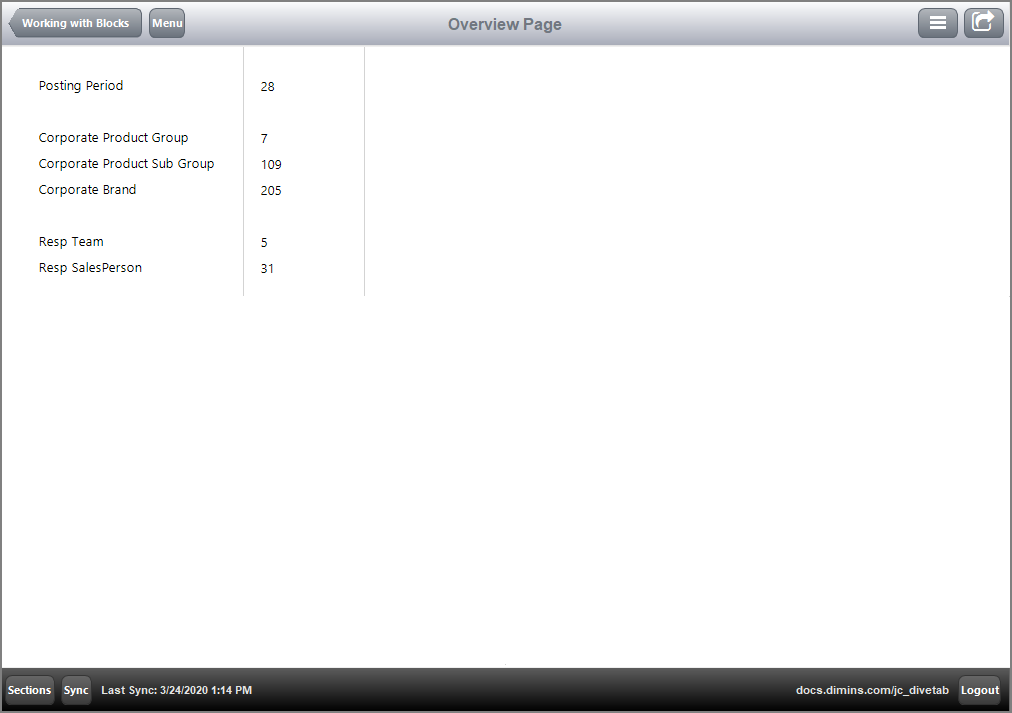
Note the hsplit block that is nested inside the vsplit block. The vertical split starts with the horizontal split at 40%, dividing the page into a top and bottom section. Then, the elements in the horizontal split claim 20 and 10 percent, meaning that, starting at the left margin, 30% of the space is used for those elements.
Here is the  result of the code in DiveTab.

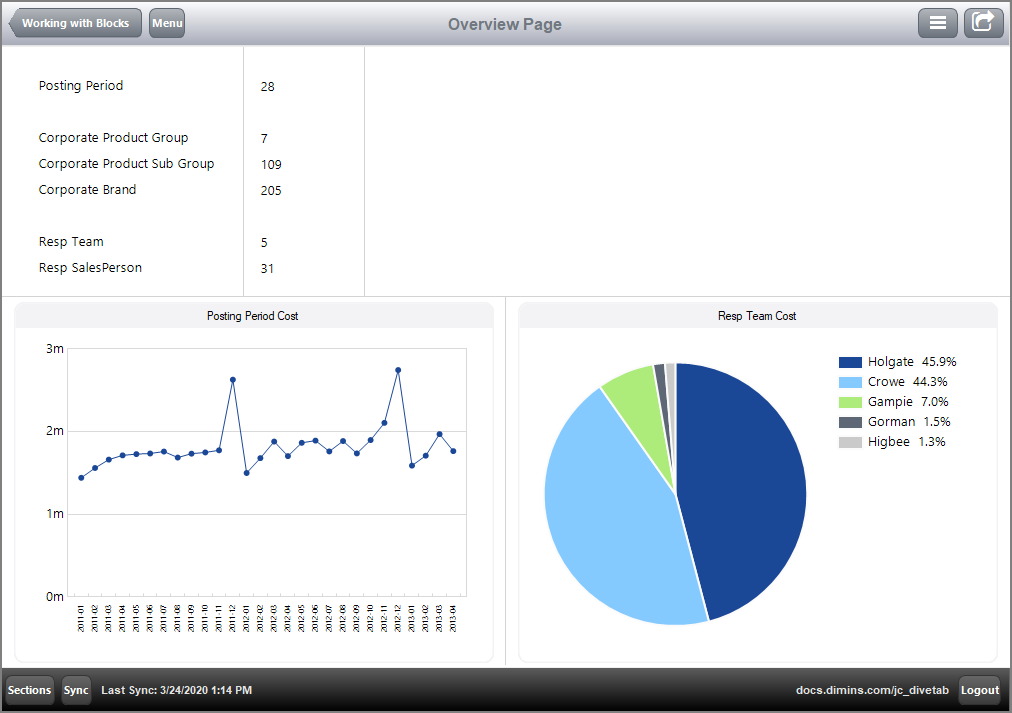
Two charts, a line chart and a pie chart, are added to the  overview page. These are used to fill the bottom 59% of the page (the horizontal split) after accounting for the spacer.

Here is the  complete code used for the overview page. The definitions block, at the top of the script, defines the grid and charts elements. Then, the layout of the data area references these elements by id to place them on the page.
divetab version = "0.0" {
  definitions {
    elements {

      grid id = "grid_labels" {
        row
        row "Posting Period"
        row
        row "Corporate Product Group"
        row "Corporate Product Sub Group"
        row "Corporate Brand"
        row
        row "Resp Team"
        row "Resp SalesPerson"
      }

      grid id = "grid_columns" {
        row
        row {
          text column = "Posting Period Count" {
            justification "left"
          }
        }
        row
        row {
          text column = "Corporate Product Group Count" {
            justification "left"
          }
        }
        row {
          text column = "Corporate Product Sub Group Count" {
            justification "left"
          }
        }
        row {
          text column = "Corporate Brand Count" {
            justification "left"
          }
        }
        row
        row {
          text column = "Resp Team Count" {
            justification "left"
          }
        }
        row {
          text column = "Resp SalesPerson Count" {
            justification "left"
          }
        }
      }

      line-chart id = "line_chart" {
        dimension "Posting Period"
        title "Posting Period Cost"
        line column = "Cost"
        hide-legend
      }
      pie-chart id = "pie_chart" {
        dimension "Resp Team"
        title "Resp Team Cost"
        column column = "Cost"
      }
    }
  }

  data-area id = "sales" {
    title "Sales"
    icon "/divetab/images/company.png"
    sections {

      overview-page {
        title "Overview Page"
        cplan "/cplans/basic_101.cplan"

        tab "Sales" {
          screen {
            layout {
              vsplit {

                hsplit percent = 40 {
                  spacer percent = 3
                  element id = "grid_labels" percent = 20
                  line percent = 2
                  element id = "grid_columns" percent = 10
                  line percent = 2
                }

                line percent = 1
                hsplit percent = 59 {
                  spacer percent = 1
                  element id = "line_chart" percent = 48
                  line percent = 2
                  element id = "pie_chart" percent = 48
                  spacer percent = 1
                }
              }
            }
          }
        }
      }
    }
  }
}
See also:
![]() code used in the cPlan.
code used in the cPlan.![]() code for a grid used by the overview page. In the complete code, this elements block is contained within the definitions block at the top of the script, and the tab block is contained within the data area.
code for a grid used by the overview page. In the complete code, this elements block is contained within the definitions block at the top of the script, and the tab block is contained within the data area.![]() result of the code in DiveTab.
result of the code in DiveTab.![]() overview page. These are used to fill the bottom 59% of the page (the horizontal split) after accounting for the spacer.
overview page. These are used to fill the bottom 59% of the page (the horizontal split) after accounting for the spacer.![]() complete code used for the overview page. The definitions block, at the top of the script, defines the grid and charts elements. Then, the layout of the data area references these elements by id to place them on the page.
complete code used for the overview page. The definitions block, at the top of the script, defines the grid and charts elements. Then, the layout of the data area references these elements by id to place them on the page.
