About Analysis Portlets
Analysis portlets display information about the Measure Factory source data. Typically, they are used as pop-up windows that open as a result of a click action from another portlet.
For example, if a cell-scoped analysis click action is enabled on a tabular portlet, clicking a cell opens an analysis portlet that shows the data that was used to determine the value in the clicked cell.
Any QuickViews that are selected in the tabular portlet are applied to the analysis portlet. In the event that the analysis portlet is part of an action group, its action group settings are ignored, and the action group setting of the triggering portlet are used.
There are two styles of analysis portlets:
-
The default measure analysis portlet shows a detailed view of the data that was used to create the measure value. Typically, it displays the same columns (or column group) as the tabular portlet
 Example
 -
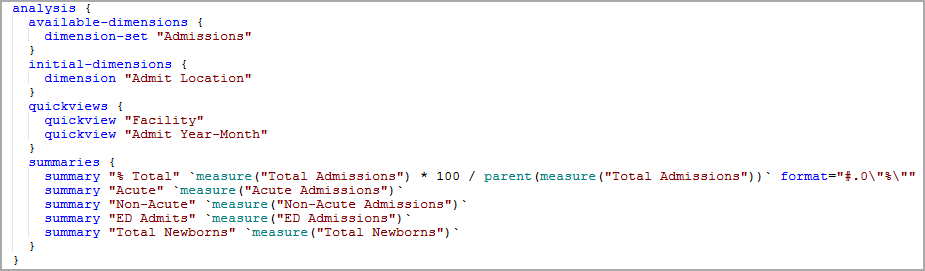
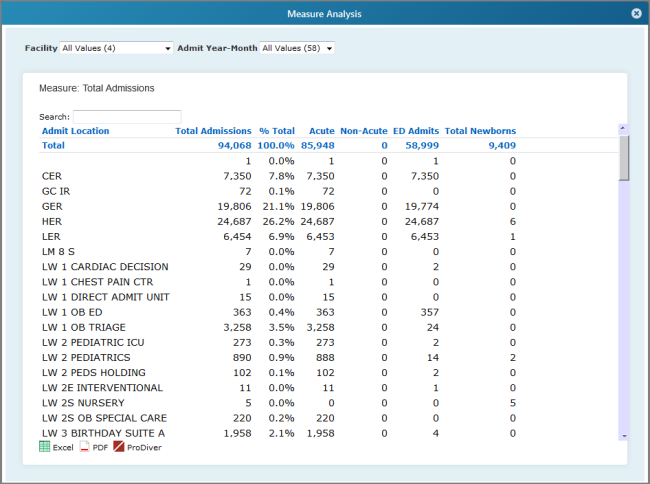
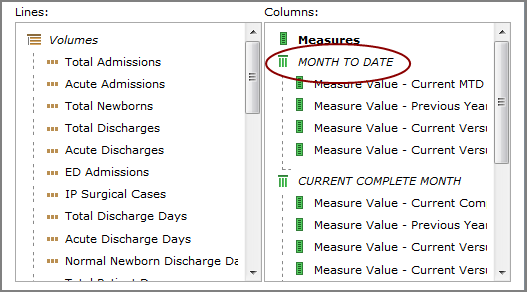
A custom measure analysis portlet displays information about the measure, not necessarily the cell value that is clicked. It uses the cfg.factory file
(measures block) to define the columns and QuickViews that display. It can compare data from multiple measures, but does not use a time-series.Example
In the following example, clicking 112 (row 5, column 3) opens a default measure analysis portlet that shows details about the data that was used to calculate the value 112, plus other calculated values in that row.
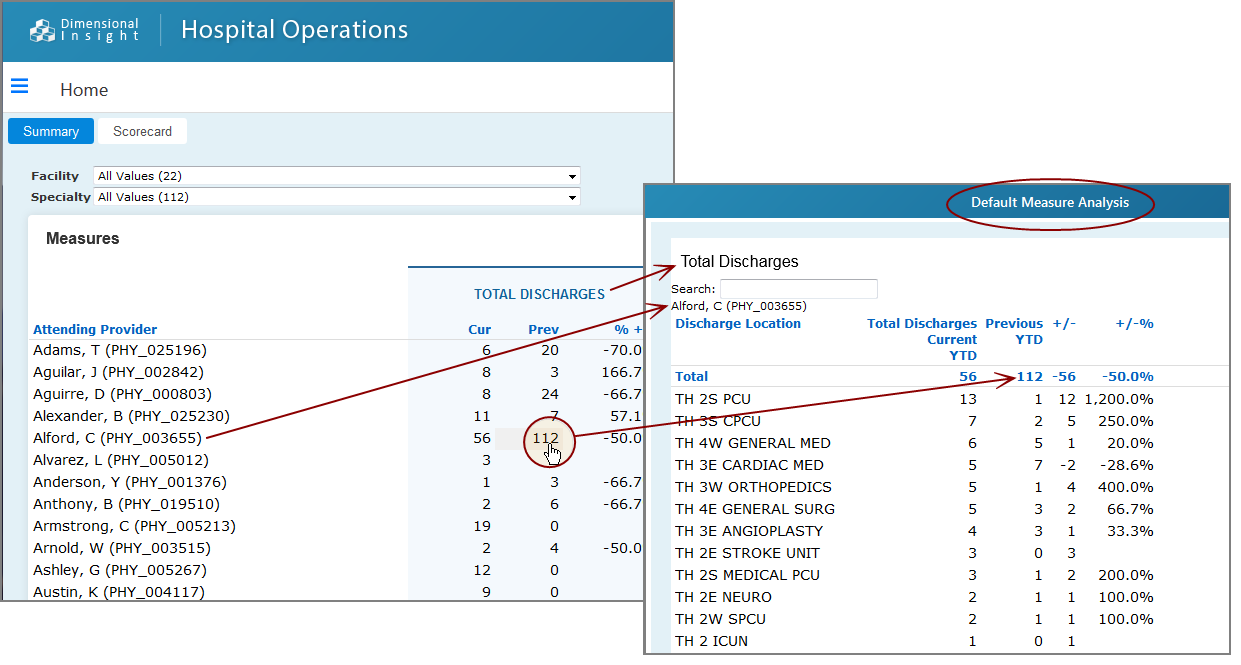
The analysis portlet has a Search box that you can use to narrow the amount of data that displays.
Column data that is longer that the specified column width are truncated and appended with an ellipsis. Placing the pointer on the truncated data opens a tooltip that shows the complete data.
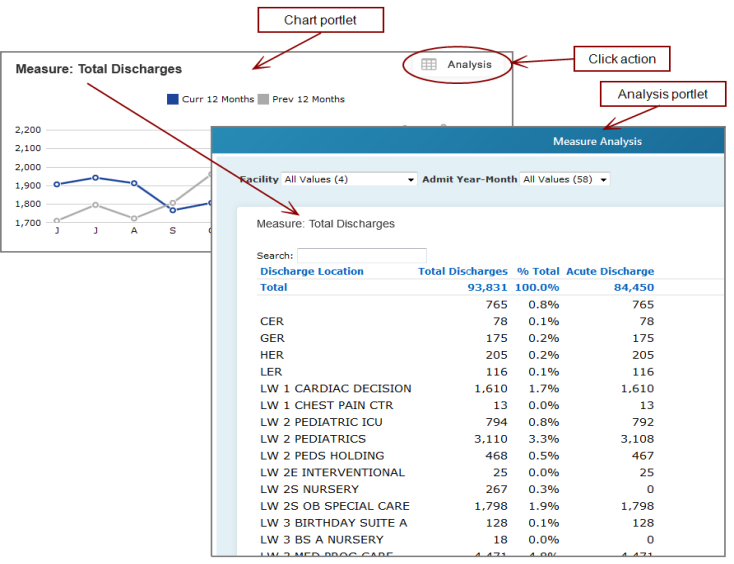
You can add an analysis click action to a non-factory portlet. When the click action is clicked, an analysis portlet displays. In this ![]() example, an analysis click action has been added to a chart portlet.
example, an analysis click action has been added to a chart portlet.
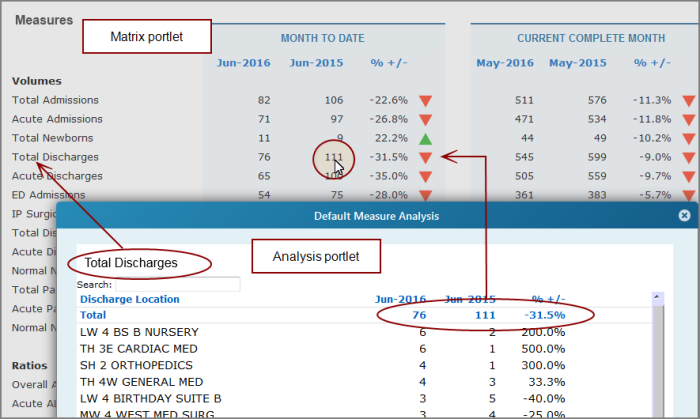
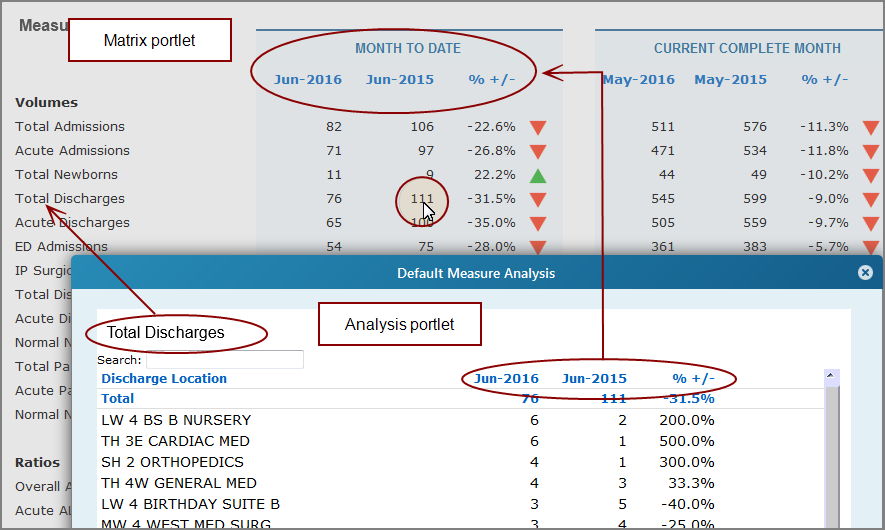
NOTE: If columns are grouped, when you click a data value, the default analysis portlet displays the columns in the column group only. For example, this matrix portlet was created with column groups.
When a value in that group is clicked (111) , the resulting default analysis portlet displays the columns in the MONTH TO DATE group only.
For more information about the cfg.factory file, see
See also: