The following cPlans and code snippets illustrate typical usage of the time series functionality.
Note that in order to create a time series for your cBase, the data needs to include dates.
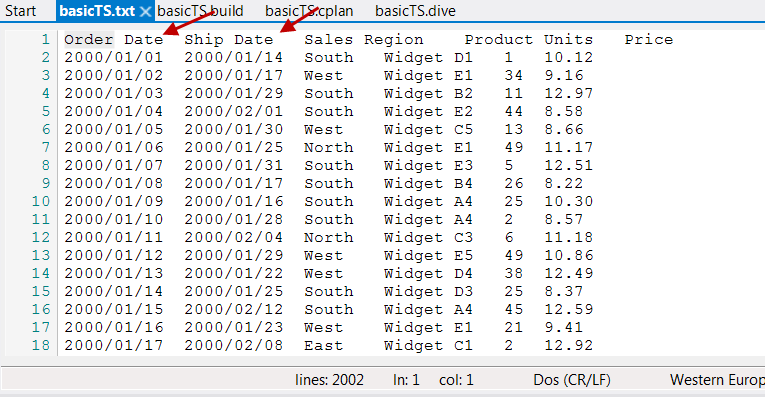
The following example includes an Order Date and a Ship Date, both with the format YYYY/MM/DD.

The basicTS.build is as follows:
build {
  text-input "basicTS.txt" {
    column "Order Date" type="date"
    column "Ship Date" input-format="YYYY/MM/DD" format="YYYY-MM-DD" type="date"
    column "Sales Region" type="string"
    column "Product" type="string"
    column "Units" type="integer"
    column "Price" type="fixed100"
  }
  add "Order YearMo" `period("gregorian month", value("Order Date"))`
  output "basicTS.cbase"
}
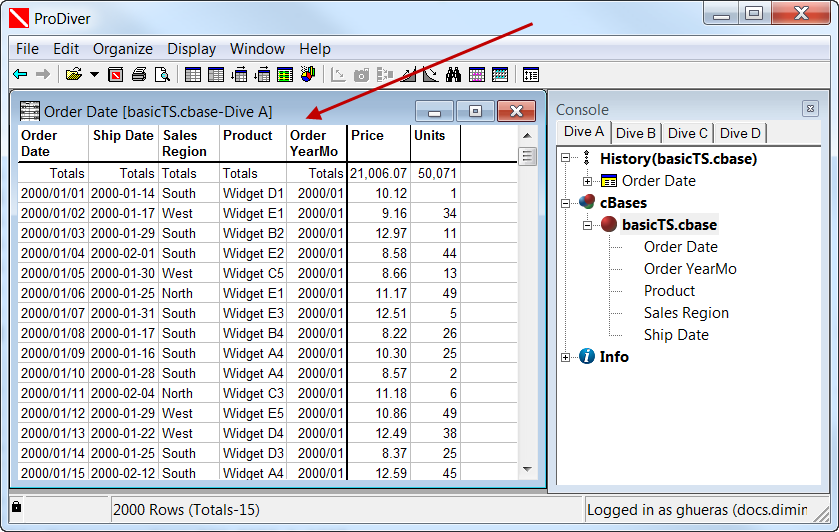
Open the cBase in ProDiver to see the six basic columns plus the calculated column "Order YearMo":

Here is the cplan, basicTS.cplan, that creates year-to-date and year-to-date last year columns for one summary "Units":
cplan {
  input "/cplan/time-series/basicTS.cbase"
  time-series {
    date "Order Date"
    anchor `date("2004/06/04")`
    summary "Units"
    ranges {
      year-to-date
    }
    variations {
      previous-year
    }
  }
}
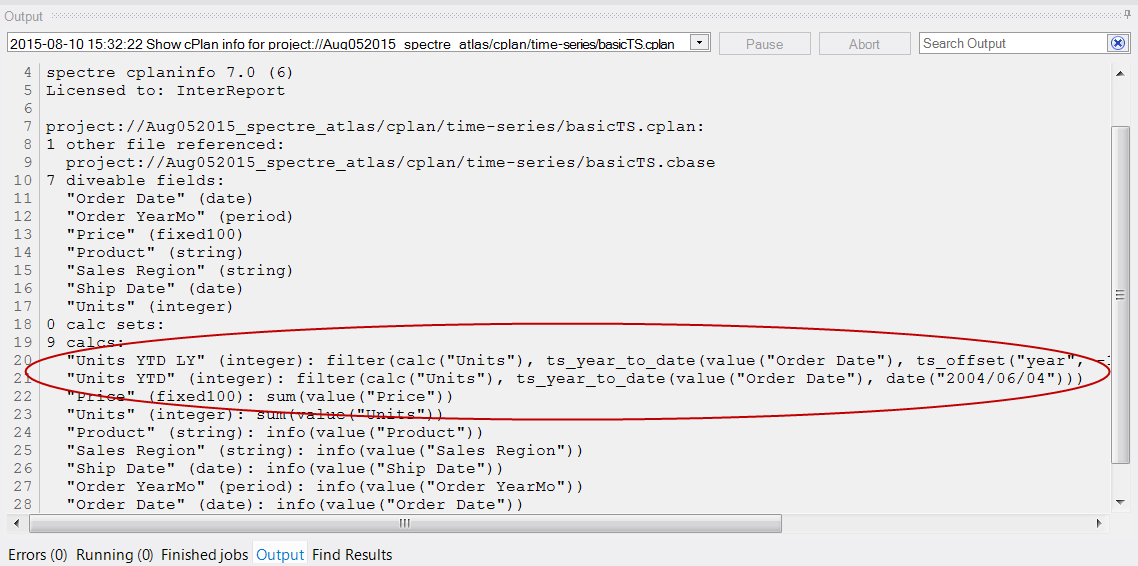
From the Explorer pane, right-click on the cPlan file, and select Run > Show cPlan Info. The cPlan information displays in the Output area.

Under calcs, there are two new columns: Units YTD LY and Units YTD.
You can script a basic dive on Sales Region, basicTS.dive, as shown here:
dive {
  cplan "basicTS.cplan"
  window {
    dimension "Sales Region"
    column "Units YTD"
    column "Units YTD LY"
  }
}
Right-click on basicTS.dive in the Explorer pane, and select Run > Run.
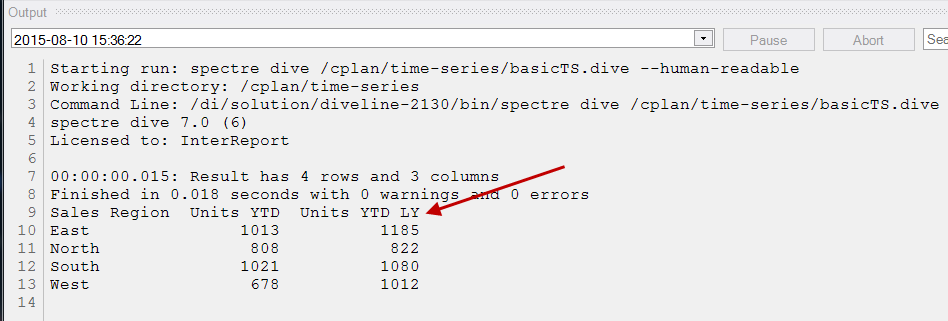
The results:

You can examine the data in ProDiver to verify the following columns for each region:
- Units YTD is based on Units with an Order Date from January 1, 2004 to the anchor date, June 4, 2004
- Units YTD LY is based on Units with an Order Date from January 1, 2003 to June 4, 2003.
To use the most recent date in the cBase as the anchor, you can use a squash expression.
cplan {
  input "test.cbase"
  time-series {
    date "Order Date"
    anchor `squash(max(value("Order Date")))`
    summary "Units"
    ranges {
      year-to-date
    }
  }
}
The following script snippet produces these columns: "Units W", "Units WTD", "Units RW4", "Units W-0", "Units W-1".
   time-series {
    date "Date"
    anchor `today()`
    summary "Units"
    ranges {
      current-week
      week-to-date
      rolling-weeks 4
      recent-weeks 2
    }
  }
A QuickView can control the time series data presented, allowing the user to pick the date.
For this example, you need to define the Dive and cPlan with parameters and connect a QuickView Set in DivePort to the parameter. For example:
Create a QuickView Set with a QuickView containing the dates that you want to offer to the user:
 quickview-set {
    cplan {
      input "/common/demo_drl.cbase"
    }
    dimension-quickview "Date" label="Anchor" all-values=false {
      default-values "2015/07/29"
    }
  }
Then, add a parameter to the cPlan for the QuickView selection:
 cplan {
    // Parameterized: the parameter controls the time-series anchor
    // Use a default value for testing without the QuickView:
    take-parameter "Date" default="2015/07/29"

    input "/common/test.cbase"

    time-series {
      date "Date"
      // "Date" parameter is a string - turn it into a date to produce the anchor
      anchor `date(param("Date"))`

      summary "Units"

      ranges {
        year-to-date
      }
    }
  }
Add the parameter to the Dive, and pass the parameter to the cPlan:
 dive {
    // Parameterized: connects with the qvset so the user can choose the anchor.
    // Use a default value for testing without the QuickView:
    take-parameter "Date" default="1998/06/30"

    cplan "test.cplan" {
      pass-parameter "Date"
    }
    window {
      dimension "Sales Region"
      column "Units YTD"
    }
  }
Finally, add a Measures Portlet for the Dive and a QuickView Portlet using the QuickView-Set. DivePort automatically hooks the "Date" QuickView up to the "Date" parameter.
This cPlan adds four columns using the calc tag. It defines a time series for two summaries and changes the column labels.
cplan {

  input "/cbases/Sales.cbase"

  calc "Qty Shipped" format="#,###;-#,###"
  calc "Profit" format="$#,###;-$#,###"

  calc "Item Count" `dimcount("Item")`
  calc "Customer Count" `dimcount("Customer")`

  time-series {
    date "Invoice Date"
    anchor `date("2014/12/31")`

    summary "Qty Shipped"
    summary "Profit"

    ranges {
      year-to-date
      current-year
      all-months
      all-quarters
 }

    variations {
      previous-years 2 {
        difference
        percent-difference
      }
    }
  }

  for "summary" "Qty Shipped" "Profit" {
    calc "$(summary) Y" {
      property "Label" `param("summary") + " " + "2014"`
    }
    calc "$(summary) Y Y-1" {
      property "Label" `param("summary") + " " + "2013"`
    }
  }
}
In order to include the year as part of a label such that it changes when the year changes, indicate how the label is formatted and build a label that includes the year from the today() function. For example:
time-series {
    ...
    summary "Qty Shipped"
    ranges {
      current-year label-format="YYYY"
    }
    ...
  }
  calc "Qty Shipped Y" {
    property "Label" `"Qty Shipped " + format_date(today(), "YYYY")`
  }
You have a date field (YYYY-MM-DD) and a Gregorian month year-month field (YYYY-MM). You want to create a field Fiscal Quarter with format YYYY-Q. You want the first quarter to be OCT-DEC, the second quarter JAN-MAR, the third quarter APR-JUN, and the fourth quarter JUL-SEP. The calendar is basically year-quarter on an October to September fiscal calendar.
First, add an offset month field:
add "Fiscal Month" `period("offset October", value("Date"))` format="YYYY-MM"
add "Fiscal Month" `period("gregorian+3 month", value("Date"))` format="YYYY-MM" (deprecated syntax)
Then, add a string column for the fiscal quarter:
add "Fiscal Quarter" ```
string(year(value("Fiscal Month")) + "-" + quarter(value("Fiscal Month")))```
If you are using a fiscal calendar, you can include a format that shows both the fiscal date and the standard date. For example, include the following column in the Build:
column "Fiscal Year-Mo" type="period" calendar="offset July" format="YYYY-MM (GYYYY-GMMM)"
column "Fiscal Year-Mo" type="period" calendar="gregorian+6 month" format="YYYY-MM (GYYYY-GMMM)" (deprecated syntax)
The offset July calendar option indicates a calendar beginning on July 1 and ending on June 30.
The deprecated gregorian+6 month calendar option indicates a fiscal calendar offset by 6 months from the standard Gregorian calendar (that is, month 1 is 6 months prior to January, therefore month 1 is July).
The "G" prefix on the format element tells Spectre to use the standard (Gregorian) counterparts for the subsequent element. For example, if the column value is for January 2016, then the displayed data is 2016-01 (2015-Jul).
The following code snippets show how to define and use four parameters as start and end dates for custom time series ranges.
cplan {
  take-parameter "ANCHOR" {
    default "XXX"
  }
  take-parameter "CALENDAR" {
    // This must be "Calendar", "Fiscal", or "Trailing"
    default "Fiscal"
  }
  take-parameter "Start-P1" {
    default "2016-01-01"
  }
  take-parameter "End-P1" {
    default "2016-08-01"
  }
  take-parameter "Start-P2" {
    default "2016-01"
  }
  take-parameter "End-P2" {
    default "2016-04"
  }

  cplan-input "/cbases/all-measures.cplan"
  import-calcs "/temp/date_anchor.txt"
 ...

   time-series {
     date "Date"
     // set anchor to "today" for month-to-date
     anchor `calc("_anchor")`

     summary "$(CALC)"

     ranges {
       custom "Period 1" start=```
         date(param("Start-P1"),"YYYY-MM-DD")
         ``` end=`date(param("End-P1"),"YYYY-MM-DD")`
       custom "Period 2" start=```
         date(param("Start-P2"),"YYYY-MM-DD")
         ``` end=`date(param("End-P2"),"YYYY-MM-DD")`
     }
     variations {
       previous-year
     }
   }
Spectre time series always uses the Standard calendar. However, columns of type period have a calendar associated with them. Date columns do not—they are always real-world Gregorian dates.
You can name a period-valued column as your time dimension, having made sure that the period uses the calendar that you want. For example:
time-series {
  date "FiscalYearMo"
  ...
}
where FiscalYearMo is defined to use the offset or custom calendar that you want.
The underlying calc functions that time series use, such as ytd(), work in this context. You can manually write filtered calcs to get the desired calculations. A work around for a completed month might be as follows:
cplan {
  cplan-input "/output-from-factory/__internal/data-sets/Accounts.cplan"
  calendar "Fiscal" type="offset July"
  dimension "Fiscal Discharge Year" ```
    format_period(period("Fiscal", "Year-Month", value("Discharge Date")), "YYYY")```
  dimension "Fiscal Discharge Year-Month" ```
    format_period(period("Fiscal", "Year-Month", value("Discharge Date")), "YYYY-MM")```
  time-series {
    date `period("Fiscal", "Year-Month", value("Discharge Date"))`
    anchor `top(max(value("Discharge Date")))`
    summary "CMS MS DRG Weight"
    ranges {
      year-to-date
    }
    variations {
      previous-year
    }
  }
}
A work around for an incomplete month might look like this:
cplan {
  cplan-input "/output-from-factory/__internal/data-sets/Accounts.cplan"
  calendar "Fiscal" type="offset July"
  dimension "Fiscal Discharge Year" ```
    format_period(period("Fiscal", "Year-Month", value("Discharge Date")), "YYYY")```
  dimension "Fiscal Discharge Year-Month" ```
    format_period(period("Fiscal", "Year-Month", value("Discharge Date")), "YYYY-MM")```
  calc "CMS MS DRG Weight YTD" `calc("CMS MS DRG Weight")` filter=```
       ytd("Fiscal", value("Discharge Date"), top(max(value("Discharge Date"))))```
  calc "CMS MS DRG Weight LYTD" `calc("CMS MS DRG Weight")` filter=```
       lytd("Fiscal", value("Discharge Date"), top(max(value("Discharge Date"))))```
  calc "CMS MS DRG Weight MTD" `calc("CMS MS DRG Weight")` filter=```
       mtd("Fiscal", value("Discharge Date"), top(max(value("Discharge Date"))))```
  calc "CMS MS DRG Weight LMTD" `calc("CMS MS DRG Weight")` filter=```
       mtd("Fiscal", value("Discharge Date"),
       offset(top(max(value("Discharge Date"))), "month", -1))```
}
Suppose you are using recent-days in a time-series. Rather than showing columns like "Units D-1" or "Units D-2", you would like to display the actual day as part of the column label. You can use the label-format attribute to specify a custom heading for the time series columns. For example:
  cplan {
    cbase-input "time-series.cbase"

    time-series {
      date "Order Date"
      anchor `date("2004/06/04")`
      summary "Units"
      ranges {
        recent-days 3 label-format="YYYY/MM/DD"
      }
      calc-set "Time Series"
    }
  }
Gives as output:
  Sales Region  Units 2004/06/04  Units 2004/06/03  Units 2004/06/02
  East                                                             8
  North
  South                       19                19
  West
See also: