This topic presents examples of code snippets for cPlan scripts.
The following cPlan adds a calculated column, and specifies a year-to-date time series for four summaries. See About Spectre Time Series.
cplan {
  cbase-input "/common/demo_drl.cbase"
  calc "Order Count" `dimcount("Order Num")`
  time-series {
    date "YearMo"
    // Anchor at the end of the last month in the cBase
    anchor `period_end(max(value("YearMo")))`
    summary "Units"
    summary "Cost"
    summary "Revenue"
    summary "Order Count"
    ranges {
      year-to-date
    }
  }
}
The following cPlan merges two inputs. Dives that use this cPlan work on both inputs simultaneously and can mix dimensions and summaries from both sides into one window. Where the columns differ, some summaries have blank values. See Multilevel cPlans.
cplan {
  multilevel {
    cbase-input "/common/basic.cbase" name="basic"
    cbase-input "/cplan/merge/one.cbase" name="one"
  }
}
When using a cPlan, how do you use a Fiscal calendar? If you have a calendar file, use the following reference in the cPlan:
cplan {
  calendar "Fiscal" file="fiscal.calendar"
}
If you want to filter a calc by the current fiscal month, you can use the time series function. For example:
calc "units CurMo" `calc("Units")` filter=`ts_current_month("Fiscal", value("Date"), today())`
See the Time-Series Functions for Spectre.
This cPlan takes two YYYY-MM formatted months as parameters and generates a custom time series range from those months:
cplan {
  take-parameter "start" {
    default "2017-04"
  }
  take-parameter "end" {
    default "2017-06"
  }
  cbase-input "/cbases/demo-sales.cbase"
    time-series {
      date "Date"
      anchor `today()`
      summary "Plan Units"
      ranges {
        custom "X" start=`date(param("start") + "-01", "YYYY-MM-DD")` end=`date(param("end") + "-01", "YYYY-MM-DD")`
      }
    }
}
The following cPlan does the same with two YYYY-MM-DD dates, which you can pass with "$(start)-01" and "$(end)-01":
cplan {
  take-parameter "start8" {
    default "2017-04-01"
  }
  take-parameter "end8" {
    default "2017-06-01"
  }
  cbase-input "/cbases/demo-sales.cbase"
  time-series {
    date "Date"
    anchor `today()`
    summary "Units"
    ranges {
custom "X" start=`date(param("start8"), "YYYY-MM-DD")` end=`date(param("end8"), "YYYY-MM-DD")`
}
}
}
The time-series block in a cPlan does not support day level time ranges when using a special calendar such as an offset or custom calendar. However, the time series functions can be used to support this. You can manually declare the calcs that the time-series produces. For example, assuming you have declared your fiscal calendar, use the following calcs:
calc "Anchor" `top(max(value("Discharge Date")))`
calc "Average LOS YTD" `calc("Average LOS")` filter=```
     ytd("Fiscal", value("Discharge Date"), value("Anchor"))```
calc "Average LOS YTD LY" `calc("Average LOS")` filter=```
     lytd("Fiscal", value("Discharge Date"), value("Anchor"))```
calc "Average LOS MTD" `calc("Average LOS")` filter=```
     mtd("Fiscal", value("Discharge Date"), value("Anchor"))```
calc "Average LOS MTD LM" `calc("Average LOS")` filter=```
     mtd("Fiscal", value("Discharge Date"),
     offset(value("Anchor"), "month", -1))```
NOTE: Because there is no lmtd() function, an offset is required for the anchor in the filter to compute month-to-date in the previous month.
See the Time-Series Functions for Spectre.
The following cPlan shows how to define a cumulative column. See Cumulative Columns.
cplan {
  cbase-input "/common/basic.cbase"
  calc "Cumulative Weight" ``` calc("Weight") + previous(calc("Cumulative Weight"), 0.0)```
}
The following cPlan shows examples of Spectre Date and Time Functions that you can use to manipulate dates.
cplan {
  cbase-input "/build/periods/periods.cbase"

  calc "today" `today()`
  calc "date1" `date("2013/03/11")`
  calc "date2" `date("Mar 11, 2013", "MMM D, YYYY")`
  calc "date_offset1" `offset(calc("Date"), "year", 1)`
  calc "date_offset2" `offset(calc("Date"), "month", 1)`
  calc "date_offset3" `offset(calc("Date"), "week", 1)`
  calc "date_offset4" `offset(calc("Date"), "day", 1)`
  calc "date_extract1" `extract(calc("Date"), "year")`
  calc "date_extract2" `extract(calc("Date"), "half")`
  calc "date_extract3" `extract(calc("Date"), "quarter")`
  calc "date_extract4" `extract(calc("Date"), "month")`
  calc "date_extract5" `extract(calc("Date"), "day")`
  calc "date_number" `date_number(calc("Date"))`
  calc "date_from_date_number" ```
      date_from_date_number(date_number(calc("Date")))
      ```
  calc "format_date1" `format_date(calc("Date"))`
  calc "format_date2" `format_date(calc("Date"), "MMM D, YYYY")`

  calc "month_name" `month_name(calc("Date"))`
  calc "day_name" `day_name(calc("Date"))`
  calc "year" `day_name(calc("Date"))`
  calc "month" `month(calc("Date"))`
  calc "day" `day(calc("Date"))`
  calc "year_day" `year_day(calc("Date"))`
}
The following cPlan shows an example of the Spectre if and case Logic Functions.
cplan {
  cbase-input "/common/basic.cbase"

  calc "if" `if(calc("Value") < 1500, "Low", "High")`
  calc "case" ```
    case(calc("Value")< 1500, "Low",
    calc("Value") < 1650, "Medium-Low",
    calc("Value") < 1800, "Medium-High", "High")
  ```
}
The following example shows how to use multiple cBases and apply a filter coming from parameters.
cplan {
  take-parameter "search-dim" default="ItemNo"
  take-parameter "search-value" default="0000007"

  multilevel {
    cbase-input "/cbases/db-set2-sub1.cbase" {
      filter `value(param("search-dim")) = param("search-value")`
    }
    cbase-input "/cbases/db-set2-sub2.cbase" {
      filter `value(param("search-dim")) = param("search-value")`
    }
  }
}
The following cPlan uses calcs and a time series.
cplan {
  cbase-input "/cbases/distributor-dbm.cbase"

  // These calcs are automatically generated from cBase columns,
  // just setting their formats here:
  calc "Cases" format="#,#.00"
  calc "Net Sales" format="$#,#"
  calc "Cost" format="$#,#"
  calc "Depletion Allowance" format="$#,#"

  // New calculation:
  calc "Gross Profit" ```
        calc("Net Sales") - calc("Cost") - calc("Depletion Allowance")
        ``` format="$#,#"

  // Dimcounts:
  calc "Resp Territory Count" `dimcount("Resp Territory")`
  calc "Resp Team Count" `dimcount("Resp Team")`

  // Time series:
  time-series {
    anchor `date("2016/04/15")`
    date "Invoice Date"
    summary "Cases"
    summary "Net Sales"

    ranges {
      year-to-date
      month-to-date
    }
    variations {
      previous-year {
        difference
        percent-difference
      }
    }
  }
}
This cPlan includes a series of calculations and then organizes them into a calc-set. The calculations include custom properties that you can use downstream for further manipulation of the data.
cplan {
   take-parameter "Census Location Code" selection=true {
      default-all-values
   }
   text-input "/data/data/census.txt"
   filter `param_match("Census Location Code", "Census Location Code")`
   calc "ADMISSIONS" `sum(value("Hourly Admissions"))` label="Admissions" format="#,###" {
       custom-property "Good Direction" "U"
	custom-property "Type" "Regular"
   }
   calc "ARRIVALS" `sum(value("Hourly New Arrivals"))` label="Arrivals" format="#,###" {
	custom-property "Good Direction" "U"
	custom-property "Type" "Regular"
   }
   calc "AVGCENSUS" `sum(value("Hourly Total Census"))` label="Avg Total Census" format="#,###.0" {
	custom-property "Good Direction" "U"
	custom-property "Type" "Avg"
   }
   calc "CENSUS" `sum(value("Hourly Total Census"))` label="Census" format="#,###" {
	custom-property "Good Direction" "U"
	custom-property "Type" "Regular"
   }
   calc "DISCHARGES" `sum(value("Hourly Discharges"))` label="Discharges" format="#,###" {
	custom-property "Good Direction" "U"
	custom-property "Type" "Regular"
   }
   calc-set "Primary Measures" {
	calc "ADMISSIONS"
	calc "ARRIVALS"
	calc "AVGCENSUS"
	calc "CENSUS"
	calc "DISCHARGES"
   }
}
The calc-set can be defined within a time-series block. For example:
cplan {
  cbase-input "Sales.cbase"
  calc "Dollars" ```
    sum(value("Price")*value("Units"))
    ``` label="$" format="$#,0.00"
  // The label becomes a prefix for the generated columns
  time-series label="TS" {
    date "Order Date"
    anchor `date("2016/06/04")`
    // produce time series for both "Units" and "Dollars"
    summary "Units"
    summary "Dollars"
    // for each summary, produce YTD, MTD, M, and Q columns
    ranges {
      year-to-date
      month-to-date
      current-month
      current-quarter
    }
    // for each summary and range, also produce
    // LY, TY Diff, and TY % Diff columns
    variations {
      previous-year {
        difference
        percent-difference
      }
    }
    // Put all columns into a calc-set,
    // so they can be easily referenced in a Dive
    calc-set "Sales T/S"
  }
}
Imagine this file, calcs.txt, potentially generated on the fly by an Integrator script or other means:
| Name | Definition | Label | Is Magical |
|---|---|---|---|
| Minimum Sales | min(value("Sales")) | MinSales | Yes |
| Maximum Sales | max(value("Sales")) | MaxSales | No |
| Average Sales | average(value("Sales")) | AvgSales | Yes |
| Median Sales | median(value("Sales")) | MedSales | No |
The following cPlan imports one calc per row, by using the Name, Definition, and Label specified. It also sets a Custom Property "Is Magical" on the calc.
cplan {
  input "/cbases/basic.cbase"
  ...
  import-calcs "calcs.txt"
}
The result is a cPlan with four additional columns. For example, the column "Minimum Sales" is defined as the minimum value in the Sales summary column, and the label in a dive is "MinSales".
Such a strategy lets you define a calc named "anchor" and then use this in your time series:
anchor `calc("anchor")`
Two cBases both contain the summary field "ActFor Dollars"
input "/cbases/forecast_ship.cbase"
input "/cbases/forecast_forecast.cbase"
The former contains values up through 2016-10. The latter contains values going up, beginning with 2016-11.
The data has different levels of granularity and can not be joined using Integrator.
A multilevel cPlan can be used to bring the columns together for a complete view of the summary. For example:
cplan {
  multilevel {
    cbase-input "/cbases/forecast_ship.cbase" {
      rename "ActFor Dollars" "ActFor Dollars Hist"
    }
    cbase-input "/cbases/forecast_forecast.cbase" {
      rename "ActFor Dollars" "ActFor Dollars Future"
    }
  }
  calc "ActFor Dollars" ```
    calc("ActFor Dollars Hist") + calc("ActFor Dollars Future")
    ```
}
The following cPlan does a lookup using a flat file in the text-input block; an add is used to create an additional column.
  cplan {
    cbase-input "/cbases/main_flow.cbase"
    lookup {
      text-input "/data/decode_wo_dupe.txt" {
        column "Code" type="string"
        column "Desc" type="string"
        add "Description" `concat(value("Code")," -- ",value("Desc"))`
      }
      key "Code" "Code"
    }
  }
You can use parameters to select the data source in a user-dependent way. This method is similar to, yet more powerful than, a particular pattern of using the 6.4 DiveLine Namespace "Search Path" feature.
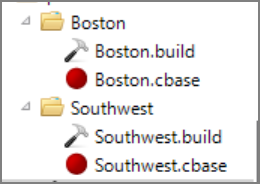
Suppose you have two different cBases and want to set up a cPlan which all users open, but depending on the server configuration, users are directed to different cBases. You can do this by including a parameter in the cPlan. The parameter controls the cBase opened by the cbase-input.
For example:

You can generalize this so that the parameter switched between different cPlans instead. For testing, you can set the parameter default to a fixed value. Then, to change the cPlan based on the user, use "default-from-user-property".
For example the common.cplan:
cplan {
  take-parameter "Sales Region" {
    // default "Boston"default-from-user-property "Sales Region"
  }
  cbase-input "$(Sales Region)/$(Sales Region).cbase"
}
Under Server Settings, there is a Sales Region User Property with a default value of "Boston".
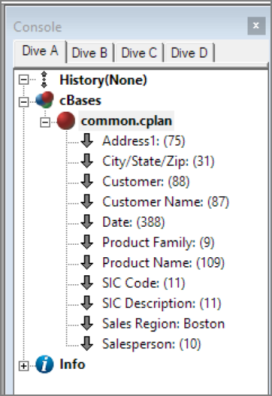
When you open common.cplan with ProDiver, you see the Boston data set, which you can confirm because the Sales Region shows Boston.

By using the Tools > Server Settings > Users > <user> > Properties tab, you can change this user's value for that property to "Southwest".
When re-opening common.cplan with ProDiver, you see the Southwest data. For example:

IMPORTANT: This method is not a substitute for access control. You still want to make sure that the users only have access to the cBases that they should be able to see. This method just guides them to the right one.
You can identify the metadata available from a cPlan as follows:
cplan {
  metadata {
    cplan "dairy.cplan"
  }
}
As an example, when run, this cPlan ![]() outputs the following:
outputs the following:
You can use these columns in a Dive to view the actual metadata values for the cPlan. For example:
dive {
  cplan {
    metadata {
      cplan "dairy.cplan"
    }
  }
  window {
    dimension "automatically generated"
    dimension "column type"
    dimension "definition"
    dimension "description"
    dimension "format"
    dimension "label"
    dimension "name"
    dimension "origin"
    dimension "required dimensions"
    dimension "suggested column"
    dimension "suggested dimension"
    dimension "summary type"
    dimension "_masked"
  }
}
For this Dive and cPlan example, the output looks like this:

See also:


