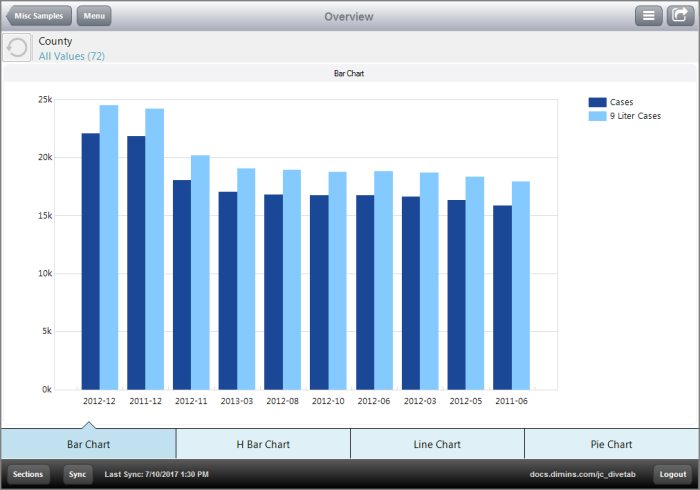
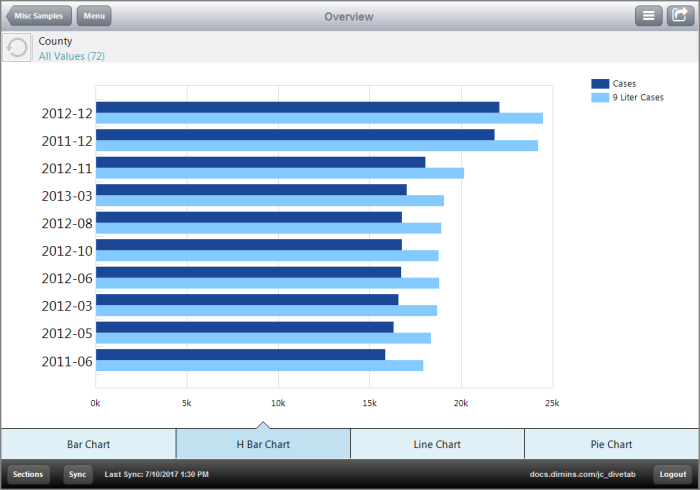
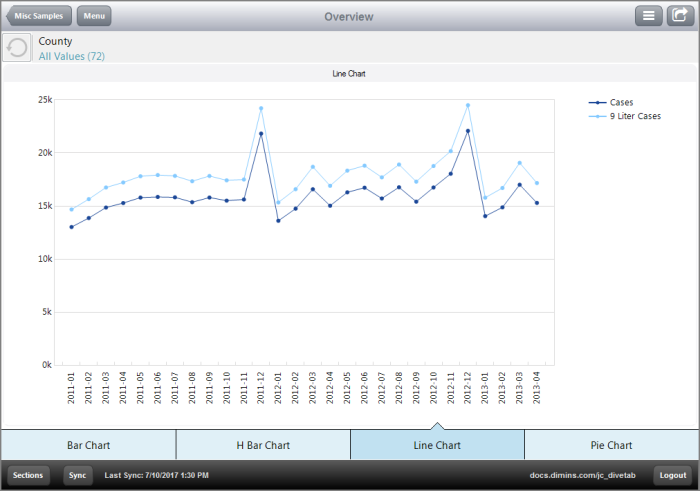
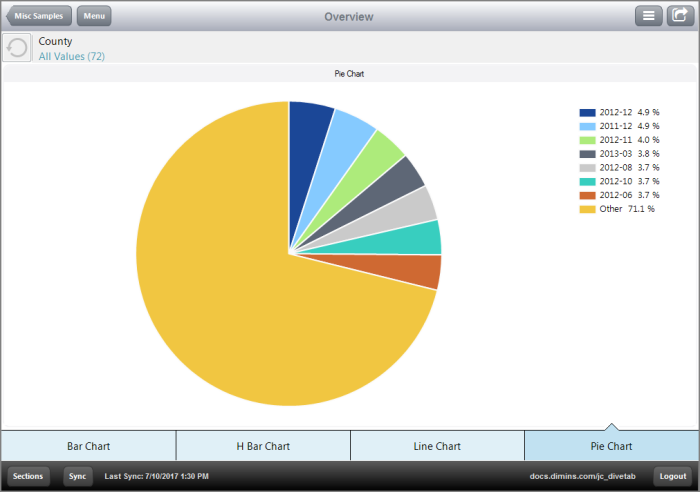
Here is an example of an overview page with four tabs, each with a different chart type.
The following code sample constructs this overview page.
  overview-page {
    title "Overview"
    cplan "/cplans/basic_101.cplan"
    quickview-set {
      cplan "/cplans/basic_101.cplan"
      dimension-quickview "County"
    }

    tab "Bar Chart" {
      screen {
        layout {
          vsplit {
            hsplit percent = 100 {
              element id = "br-yearmo" percent = 100
            }
          }
        }
      }
    }
    tab "H Bar Chart" {
      screen {
        layout {
          vsplit {
            hsplit percent = 100 {
              element id = "hbar-yearmo" percent = 100
            }
          }
        }
      }
    }
   tab "Line Chart" {
      screen {
        layout {
          vsplit {
            hsplit percent = 100 {
              element id = "ln-yearmo" percent = 100
            }
          }
        }
      }
    }
    tab "Pie Chart" {
      screen {
        layout {
          vsplit {
            hsplit percent = 100 {
              element id = "pc-yearmo" percent = 100
            }
          }
        }
      }
    }
    elements {

      bar-chart id = "br-yearmo" {
        cplan "/cplans/basic_101.cplan"
        title "Bar Chart"

        dimension "Posting Period"
        bar column = "Cases"
        bar column = "9 Liter Cases"

        sort-column "Cases"
        first 10
      }

      hbar-chart id = "hbar-yearmo" {
        cplan "/cplans/basic_101.cplan"

        dimension "Posting Period"
        bar column = "Cases"
        bar column = "9 Liter Cases"

        sort-column "Cases"
        first 10
      }

      line-chart id = "ln-yearmo" {
        cplan "/cplans/basic_101.cplan"
        title "Line Chart"

        dimension "Posting Period"
        line column = "Cases"
        line column = "9 Liter Cases"
      }

      pie-chart id = "pc-yearmo" {
        cplan "/cplans/basic_101.cplan"
        title "Pie Chart"

        dimension "Posting Period"
        column column = "Cases"
      }
    }
  }
You can include a link to another page for the column attribute. If a parameter is included on the target page, the value selected is passed to the target page.
For bar, h-bar, and line charts the links are accessible through the chart values. For pie charts, the links can be accessible through the legend and chart values.
See also:


