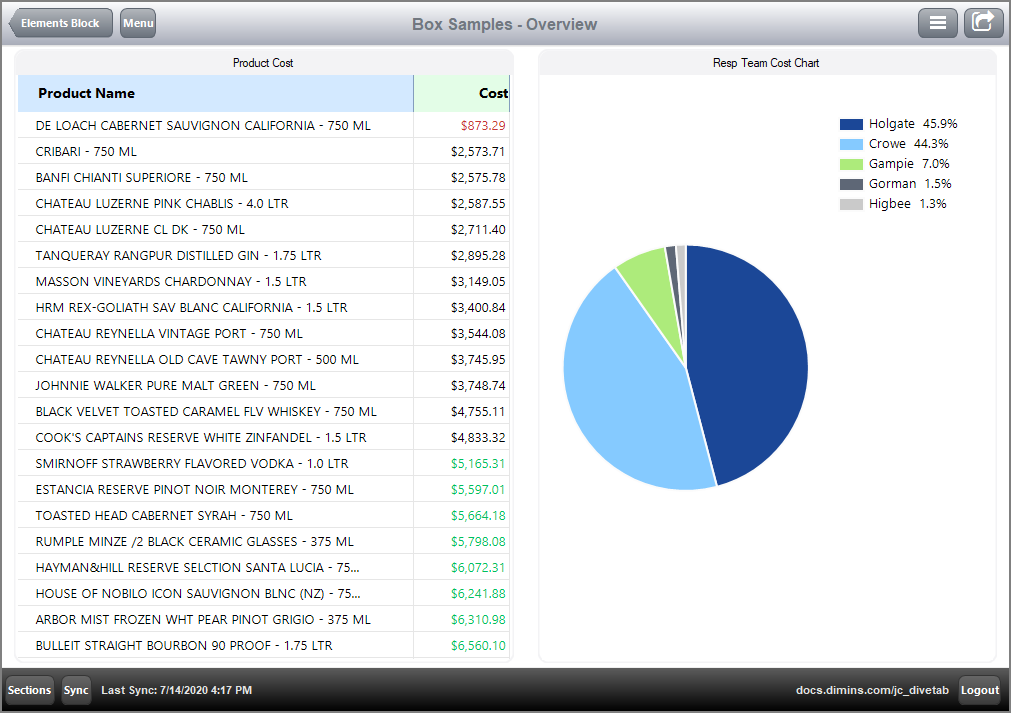
Here is an example of an overview page that uses two boxes.
  overview-page {
    title "Box Samples - Overview"
    cplan "/cplans/basic_101.cplan"

    tab "Box" {
      screen {
        layout {
          vsplit {
            hsplit percent = 100 {
              spacer percent = 1
              box percent = 50 {
                title "Product Cost"
                element id = "tb-product-color"
              }
              spacer percent = 2
              element id = "pc-product" percent = 46
              spacer percent = 1
            }
          }
        }
      }
    }

    elements {
      table id = "tb-product-color" {
        dimension "Product Name"
        text column = "Cost" {
          value-format "$#,###.00"
          high-color "00BF5E"
          low-color "C53737"
          threshold-value column = "Cost"
          low-threshold 2000
          high-threshold 5000
        }
        sort-column "Cost" reverse = true
        first 21
      }
      pie-chart id = "pc-product" {
        title "Resp Team Cost Chart"
        dimension "Resp Team"
        column column = "Cost"
      }
    }
  }
Here is the ![]() result of the code in DiveTab.
result of the code in DiveTab.
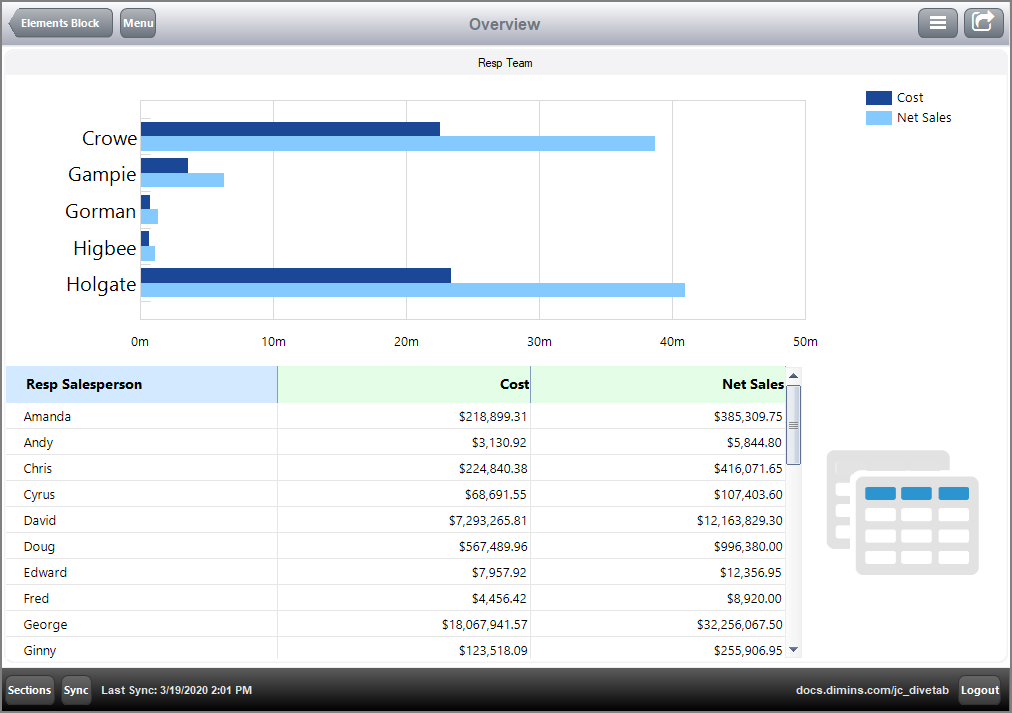
Here is an example of another overview page that uses one box, and contains three elements: an hbar chart, a table, and an image.
  overview-page {
    title "Overview"
    cplan "/cplans/basic_101.cplan"

    tab "H Bar Chart" {
      screen {
        layout {
          vsplit {
            hsplit {
              element id = "box"
            }
          }
        }
      }
    }

    elements {
      box id = "box" {
        title "Resp Team"
        vsplit {
          hsplit percent = 50 {
            hbar-chart percent = 100 {
              dimension "Resp Team"
              bar column = "Cost"
              bar column = "Net Sales"
            }
          }

          hsplit percent = 50 {
            table percent = 80 {
              dimension "Resp Salesperson"
              text column = "Cost" {
                value-format "$#,###.00"
              }
              text column = "Net Sales" {
                value-format "$#,###.00"
              }
            }
            image percent = 20 {
              path "/divetab/images/menu icons/22.png"
            }
          }
        }
      }
    }
  }
Here is the ![]() result of the code in DiveTab.
result of the code in DiveTab.
By containing an hbar-chart within a box element, it is possible to apply a title—an hbar-chart does not have a title otherwise.
See also:

