The portlet creation wizard displays options that are available for the current circumstance. Selecting an option can affect subsequent wizard page options.
To add a chart portlet to a page:
- In DivePort, browse to the page where you want to add the portlet.
-
On the DivePort toolbar, click Edit to unlock the page and enable edit mode.
The Edit menu item is replaced with edit tools, including a page context menu chevron.
- On the toolbar, click the chevron.
- On the page context menu, click Add a Portlet.
-
On the Add Portlet page, double-click Chart
The Edit Chart Portlet, Select a data source
 page opens. This is the first page of a portlet creation wizard.
 -
From the Project list, select a data source, and then click Next.
The Select a chart type
dialog box opens, showing a gallery of available chart types.TIP: You can use the Search box to locate a specific type of chart or click the Menu icon
 to select an option for sorting the list.
 -
Select a chart type, and then click Next.
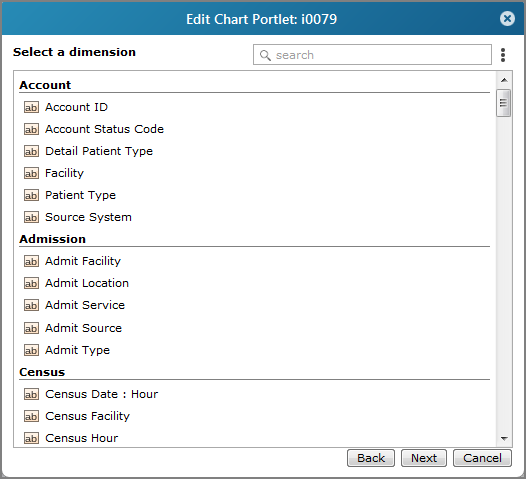
The Select a dimension
page opens.TIP: You can reorder the Select a dimension list by clicking the menu icon
and selecting a sort option. Or, if you know the name of the dimension that you want to use, you can enter all or part of the name in the search box to narrow the options in the list. -
Select the dimension that you want to use for the chart, and then click Next.
- If you are adding a MultiTab chart type, the Select a category dialog box opens. Proceed to step 9.
- If you are adding a chart type that is not MultiTab, the Select values page opens. Proceed to step 10.
NOTE: If you select a period-type dimension, rows are sorted chronologically. If there are gaps in the data, any period without data does not appear on the chart. If this occurs, you can create a row in the data source that contains a null value to replace the missing data.
- On the Select a category dialog box, select a dimension that is used to split the initial dimension value into MultiTab categories.
-
On the Select values page, select the columnar values that you want to use on the chart, and then click Next.
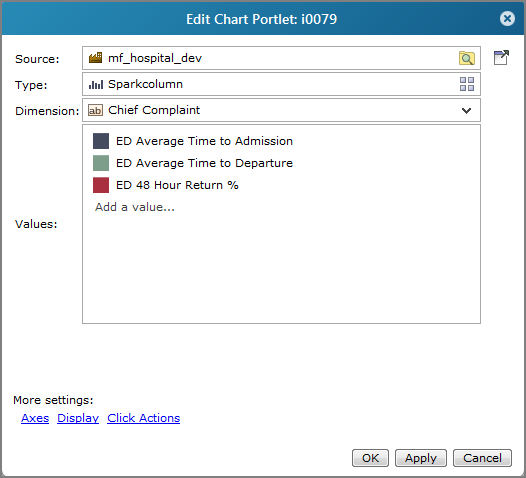
The Edit Chart Portlet
main page opens, showing the main properties of the chart. -
Review the Source, Type, Dimension, and Values settings and make any needed changes.
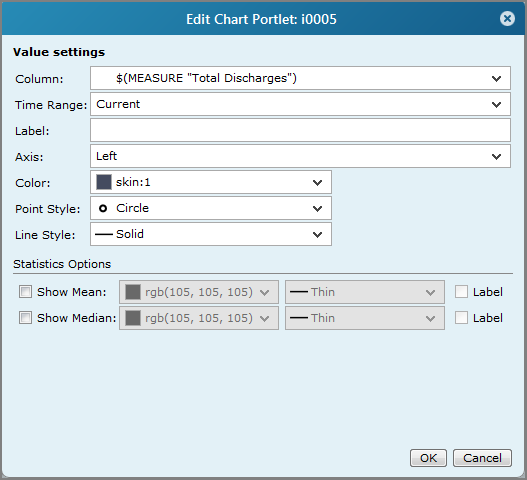
NOTE: In the Values area, you can place the pointer on a
value row to enable the Edit this value icon  , which you can click to edit the Value settings, including value Column, Label, Color, and more. Other options vary, depending on chart type.
 - Under More settings, you can select property settings for the graph Axes, Legend, Text, Display, or add Click Actions.
- Click OK.
- On the tool bar, click Save to exit edit mode and lock the page.


See also:
- Portlet Instance Settings
- About Chart Portlets
- Chart Portlet Options
- About Click Actions
- Click Actions on Heatmatrix Charts
- Adding, Editing, or Removing a Click Action