Builder has a limit of 32 core dimensions per model. For performance reasons, the recommended number of core dimensions is 10–15, as having more might affect build times and model size.
Dynamic dimensions are info fields that are promoted to a diveable state. DiveMaster allows you go beyond the 32-dimension limit by saving dynamic dimensions in a DivePlan. See About Promoting Info Fields to Dynamic Dimensions. ProDiver can also promote info fields to dynamic dimensions with Edit > Add/Edit Dimensions.
This topic provides steps about how to decide if a field is best classified as a core or dynamic dimension.
-
Create logical groups of all the selected dimensions.
For example, you might have a data set containing a time group such as a Date, Year, Month, and Quarter as well as sales organization group containing Salesperson, Sales Branch, and Sales Region. Dimensions in each group must be related in some logical manner. You would not have Sales Branch in the time group or Year in the sales group.
-
After the dimensions are organized by group, you need to understand the relationships among them by asking questions like:
- What dimensions are subordinate to the others?
- Does a hierarchy exist?
- For example, in the sales organization group, a Salesperson belongs to a Sales Branch, which in turn belongs to a particular Sales Region. So, Sales Branch is subordinate to Sales Region, and Salesperson is subordinate to both Sales Branch and Sales Region.
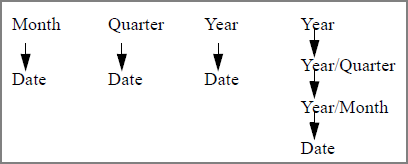
- It is important that these relationships are accurately established and clearly understood. In the time group example, one might think that Date is subordinate to Month, Quarter, and Year. In actuality, Date is only subordinate to a particular month, a particular quarter, and a particular year. As a hierarchy, Date is subordinate to Year/Month, which is subordinate to Year/Quarter, which is subordinate to Year. Thus, there are four separate hierarchies in the time group as shown
 here.
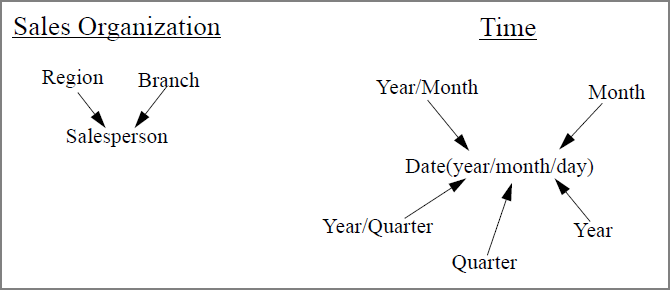
here. - Because the bottom of the hierarchy is related to all dimensions above it, all fields can be put into star diagrams as shown
 here.
here.
- Opposite to what you might think, the detail-level fields that are in the center of the star diagram (bottom of hierarchy) become the potential core dimensions, that is, those dimensions that are presummarized and optimized by Builder. In the example here, Salesperson and Date are the core dimensions.
-
After you have identified potential core dimensions, look at the other fields in each group. The remaining fields are potential dynamic dimensions, that is, those dimensions that are not presummarized by Builder. The quantity relationships between the core and dynamic dimensions can help classify each.
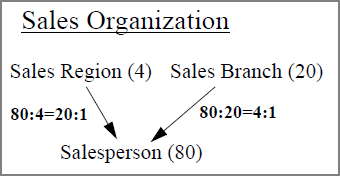
- For example, assume there are four Sales Regions, 20 Sales Branches, and 80 Salespeople as shown
 here.
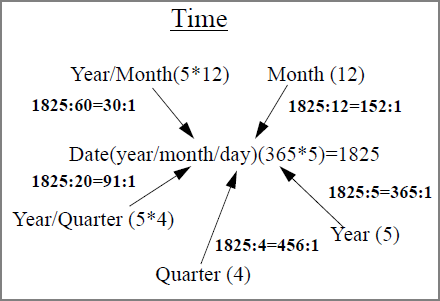
here. - In a time group of five years, for example, all the ratios between Date and the other fields are greater than 20:1 as shown
 here.
here. -
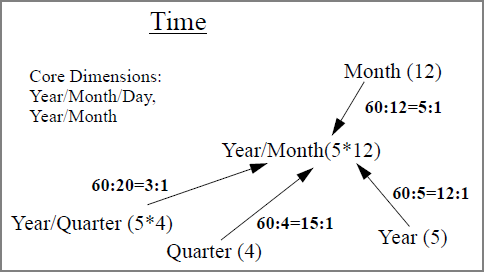
Since the 20:1 ratio is exceeded in the time group example, make the most subordinate element, which here is Date, a core dimension and reconsider the remaining items. The next level up the hierarchy from a specific Date is the Year/Month field, so redraw the star diagram as shown
 here.
here. Note that the ratios are now within the 20:1 guideline. So if Year/Month is also a core dimension, all additional fields become potential dynamic dimensions.
Keep the following points in mind:
- It is important to look at expected dive paths to determine if ratios are exceeded. For example, going from Year (5) to Date (1825) presents an exceeded ratio (365). Any time the expected dive path yields an exceeded ratio, both fields should be core dimensions.
- As you go through this process, keep in mind the dimensions that users are most likely to select to access data. To optimize client performance, these dimensions should be core dimensions.
- The fields you identified as candidates for dynamic dimensions are defined as info fields in the build process. You then use DiveMaster on the model to promote these info fields to dynamic dimensions. See About Promoting Info Fields to Dynamic Dimensions.
Note the ratio between Salesperson and Sales Region (20:1) and the ratio between Salesperson and Sales Branch (4:1). The general rule is if the ratio of the bottom field (Salesperson) to the higher field (Sales Branch) does not exceed 20:1, the higher field can be a dynamic dimension. A higher ratio works, but there is a perceptible degradation in performance.
