The following code snippets demonstrate some calculation examples that can be added to cPlans.
You can assign constants with the calc name and expression syntax.
// Examples of major column types, using constant expressions.
cplan {
input "/common/basic.cbase"
calc "Integer" `12345678`
calc "Fixed100" `876543.21`
calc "Double" `0.12345678`
calc "String" `"Foo"`
calc "Date" `date("2012/03/08")`
calc "Period" `period("standard", "year-month", date("2015/11/30"))`
}
The periods.cbase has a column named Date that is referenced in the following expressions.
// Examples of date manipulations.
cplan {
  input "/build/periods/periods.cbase"
  calc "today" `today()`
  calc "date1" `date("2013/03/11")`
  calc "date2" `date("Mar 11, 2013", "MMM D, YYYY")`
  calc "date_offset1" `offset(calc("Date"), "year", 1)`
  calc "date_offset2" `offset(calc("Date"), "month", 1)`
  calc "date_offset3" `offset(calc("Date"), "week", 1)`
  calc "date_offset4" `offset(calc("Date"), "day", 1)`
  calc "date_extract1" `extract(calc("Date"), "year")`
  calc "date_extract2" `extract(calc("Date"), "half")`
  calc "date_extract3" `extract(calc("Date"), "quarter")`
  calc "date_extract4" `extract(calc("Date"), "month")`
  calc "date_extract5" `extract(calc("Date"), "day")`
  calc "date_number" `date_number(calc("Date"))`
  calc "date_from_date_number" `date_from_date_number(date_number(calc("Date")))`
  calc "format_date1" `format_date(calc("Date"))`
  calc "format_date2" `format_date(calc("Date"), "MMM D, YYYY")`
  calc "month_name" `month_name(calc("Date"))`
  calc "day_name" `day_name(calc("Date"))`
  calc "year" `day_name(calc("Date"))`
  calc "month" `month(calc("Date"))`
  calc "day" `day(calc("Date"))`
  calc "year_day" `year_day(calc("Date"))`
}
If you include a column in a cBase that contains email addresses, you can define a calc to open with an email client. For example, if you have a cBase column named E-Mail with email addresses, you can define the following calc in a cPlan:
calc "Email Link" `"mailto:" + info(value("E-Mail"))`
This calc creates another column, using the mailto:<address> CSS trick to open the default email client and populate the To field with the email address. You can implement this behavior by using "Email Link" in a DivePort or DiveTab web link.
In this example, the basic.cbase input file has a summary column named Value. The if()and case() logic functions evaluate expressions and assign different results based on the Value column.
// if(boolean_condition, if_true, if_false
// case(boolean_condition_1, value_1, boolean_condition_2, value_2, ... value_else)
cplan {
input "/common/basic.cbase"
calc "if" `if(calc("Value") < 1500, "Low", "High")`
calc "case" ```
case(calc("Value") < 1500, "Low",
calc("Value") < 1650, "Medium-Low",
calc("Value") < 1800, "Medium-High", "High")
```
}
The basic.cbase has a summary column named Value that is referenced in these expressions.
cplan {
  input "/common/basic.cbase"
  calc "pow" `pow(calc("Value"), 1.5)`
  calc "exp" `exp(calc("Value") / 1000)`
  calc "ln" `ln(calc("Value"))`
  calc "log10" `log10(calc("Value"))`
  calc "sqrt" `sqrt(calc("Value"))`
  calc "mod" `mod(calc("Value"), 123.4)`
}
The basic.cbase has summary columns named Value and Direction that are referenced in these expressions.
cplan {
  input "/common/basic.cbase"
  calc "total" `sum(value("Value"))`
  calc "min" `min(value("Value"))`
  calc "max" `max(value("Value"))`
  calc "any" `any(value("Direction"))`
  calc "count" `count()`
  calc "ucount" `ucount(value("Direction"))`
  calc "average" `average(value("Value"))`
  calc "geomean" `geomean(value("Value"))`
  calc "stddev" `stddev(value("Value"))`
  calc "median" `median(value("Value"))`
  calc "percentile" `percentile(value("Value"), 25)`
}
Spectre summary functions operate on columns of data to produce a single value. The summary functions take a set of records as input. When you dive, the summary expression for a column is evaluated for each row, which corresponds to each unique combination of dimension values. The function runs on the set of cBase records that have those dimension values.
When you want an expression to run on a different set of records, you have the option of wrapping the expression in a call to one of the following functions:
- top—All of the records in the data set.
- parent—The records used to create this window, which means taking the parent windows and QuickViews into account. Note that this is what the Totals represents, if present.
- filter—Filter the current row's set of records further, using some predicate.
For example, to calculate the percent of total where you want to limit the summary to the window data, use parent() in the calc statement.
calc "LY % of $" `calc("LY $")/parent(sum(value("LY $")))`
See also:
Use if-then-else logic to handle branching in a calc block.
// If there is only one value for a dimension, display that value else
// display the number of values.
cplan {
  input "/common/infos.cbase"
  calc "States" ```
      // if City/State has only one value
      if(dimcount("State") = 1,
        // then that value
        any(value("State")),
        // else, number of values as a string
        string(dimcount("State")))
      ```
}
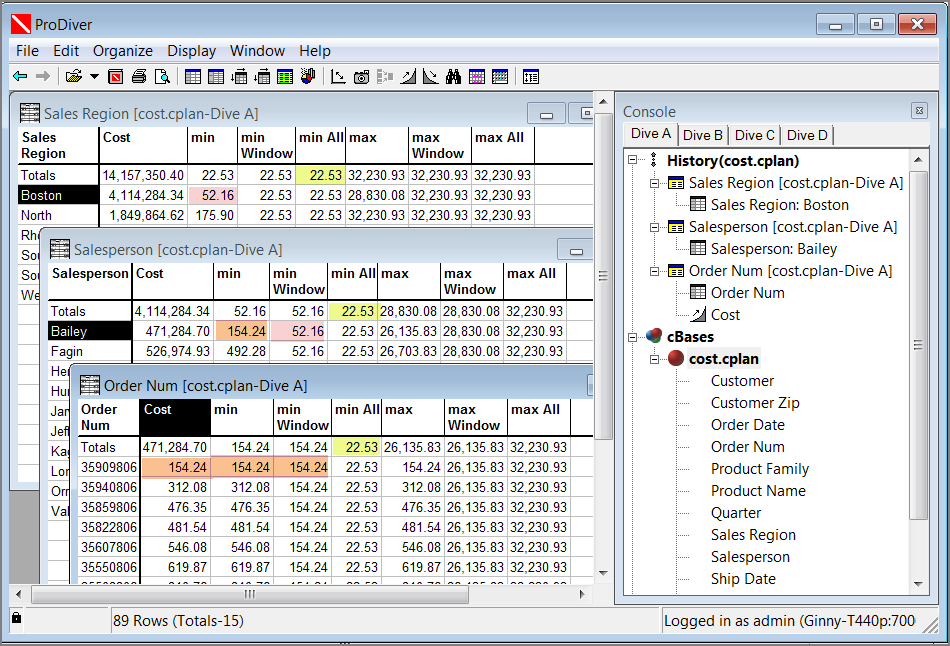
Min and max functions behave differently when paired with parent or top. Consider the following cPlan:
cplan {
  input "demo_drs0.cbase"

  calc "min" `min(value("Cost"))`
  calc "min Window" `parent(min(value("Cost")))`
  calc "min All" `top(min(value("Cost")))`

  calc "max" `max(value("Cost"))`
  calc "max Window" `parent(max(value("Cost")))`
  calc "max All" `top(max(value("Cost")))`

}
When used in the following ![]() dive, the results are as shown.
dive, the results are as shown.

This view of the dive is easier to understand in ProDiver by diving on the sales region and salesperson and seeing how the minimum calculation, for example, varies by the dive depth, along with the minimum window calc using the parent function, and minimum all calc using the top function.

The column min All stays consistent—it is the minimum cost record (Order Num) for the entire data set: 22.53.
The minimum for Boston is 52.16, as shown in the Workbench dive, which becomes, in the second dive, the value for the min Window calc using the parent function.
The minimum cost for Bailey is 154.24 which the minimum cost record for Bailey's Order Num's.
The following snippet shows how to find the minimum and maximum value in a grouping of data.
cplan {
cbase-input "/factory-output/__internal/data-sets/Accounts.cbase"
calc "Max Admit Date" `max(value("Admit Date"))` format="MM-DD-YYYY"
calc "Min Admit Date" `min(value("Admit Date"))` format="MM-DD-YYYY"
calc "Max Discharge Date" `max(value("Discharge Date"))` format="MM-DD-YYYY"
calc "Min Discharge Date" `min(value("Discharge Date"))` format="MM-DD-YYYY"
}
See also: Spectre Format Conventions
Mentioned in: