Spectre summary functions operate on columns of data, rather than rows, to produce a single value. They can be used when doing a dive.
For example:
`any(value("Address"))`returns the value of the "Address" column in a randomly selected row
For example:
`average(value("Price"))` returns the average for the "Price" column
For example:
`const(value("Extract Date"))` returns the value from one row in the "Extract Date" column
For example:
`count()` returns the number of rows in the working set
`filter(count(), value("State") = "Ohio")` returns the number of rows where "State" is "Ohio"
For example:
`first(value("Charge"))` returns the first charge encountered for the dimension value in the data set
For example:
`geomean(value("Price"))` returns the geometric mean value of the price column
For example:
In a table where column "X" has values 1, 2, 3, 4, 5, `harmean(value("X"))` returns 2.189781
For example:
calc "Customer Count" `hyperloglog(8, value("Customer Name"))` returns an estimate of unique customers
calc "Cust Product Count" `hyperloglog(8, value("Customer Name"),value("Product Name"))` returns an estimate of the unique combinations of customer and product
For example:
`info(value("Address"))` returns the value found in the "Address" column if all values are the same. If all values are not the same, returns an error.
intercept(y-value: numeric, x-value: numeric) : double
For example:
`intercept(value("Y"), value("X"))` returns 1.0 with the indicated ![]() Y and X values.
Y and X values.
`intercept(value("Y"), value("X"))` returns 0.0 with the indicated ![]() Y and X values.
Y and X values.
`intercept(value("Y"), value("X"))` returns -9.0 with the indicated ![]() Y and X values.
Y and X values.
For example:
This is mostly the same as sum(), with very rare exceptions, but in a table where column "X" has values 1.001, 2.002, 3.003, 4.004, 5.005, `kahan_sum(value("X"))` returns 15.015.
For example:
In a table where column "X" has values 1, 2, 3, 4, 5, `kurtosis(value("X"))` returns -1.2
For example:
`last(value("Direction"))` returns the last direction encountered for the dimension value in the data set
For example:
`max(100, 300, 500)`returns 500
For example:
`max(value("Price"))`returns the maximum value in the "Price" column
`max(value("Ship Date"))` returns the maximum Ship Date for the current working set. If a dive is on a particular customer, this expression returns the last ship date for that customer only.
For example:
`median(value("Salary"))`returns the median value from the Salary column
For example:
`min(100, 300, 500)`returns 100
For example:
`min(value("Price"))`returns the minimum value in the price column
For example:

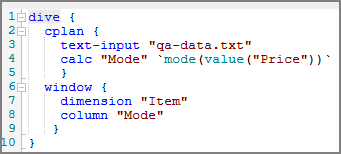
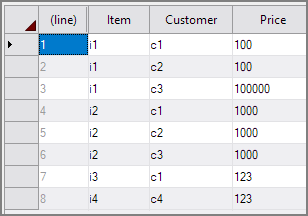
Using this data:

Yields these results:

For example:
In a table where column "X" has values 1, 2, 3, 4, 5, `mul(value("X"))` returns 120
For example:
`percentile(value("Units), 75)` looks at all of the Units values in the working set, and returns the value at the 75th percentile. If you sorted the Units in the working set from highest to lowest, the expression returns the value three-fourths of the way down the list.
`percentile(value("Units"), 50)` is equivalent to `median(value("Units"))`
`filter(percentile(value("Units"), 75), value("Units") != 0)` filters out zero units from the working set before calculating the 75th percentile
slope(y-value: numeric, x-value: numeric) : double
For example:
`slope(value("Y"), value("X")` gives 0.428571429 with the indicated ![]() Y and X values.
Y and X values.
`slope(value("Y"), value("X")` gives 0.6 with the indicated ![]() Y and X values.
Y and X values.
`slope(value("Y"), value("X")` gives 1.0 with the indicated ![]() Y and X values.
Y and X values.
For example:
`squash(max(squash(calc("X"), "D")))` computes calc("X") for each value of "D" (as if you made a window on "D"), and then returns the max of those "X" values. This is the equivalent of DimMax[<dimension>,<summary>] in ProDiver.
calc "Solid Doses Sedative" ```squash(sum(squash(filter(calc("Solid Quantity"),
value("BJA Class") = "Sedative"
and dimcount("Prescriber Name-DEA") >= 5
and dimcount("Pharmacy Name-DEA") >= 5),
"ID")))``` returns the number of solid dose sedatives that were prescribed to patients with more than 5 prescribers and more than 5 pharmacies.
When used in a cPlan, this calc says:
- From here, dive on "ID" (the inner squash(... "ID"))
- For each "ID", compute "Solid Quantity" (the calc(...)) for each record where "BJA Class" is "Sedative" and where that "ID" has at least 5 of the two dimcounts (the filter(...))
- Sum all of those computed "Solid Quantity" values (squash(sum(...)))
Suppose you have a dimension ID, and a dimension Source, and every ID should come from a single Source. You want to compute a single number that tells you if every ID has a single Source value associated with it. You could write a dimensionless dive that computes the number you want, using squash() to dive off each ID and check the dimcount of Source. For example:
dive {
  cplan {
    text-input "squashdata.txt"
  }

  window {
    column "Conflicted Count" `squash(sum(squash(if(dimcount("Source") > 1, 1, 0), "ID")))`
  }
}
This gives the number of IDs which have more than one Source.
For example:
`squash_right(sum(value("Rev")), 2)` squashes records by eliminating values from the right. The "2" is the number of dimensions to roll up and eliminate from the right in the multitab. This value defaults to 1.
For example:
`stddev(value("Value"))` returns the standard deviation for the sample values
For example:
`stddevp(value("Value"))` returns the standard deviation for the population values
For example:
`filter(sum(value("Revenue")), value("State") = "Ohio")`returns the sum of "Revenue" where "State" is "Ohio"
`sum(value("Revenue"))` returns the total for the Revenue column
`sum(value("Price") * value("Units"))` returns the total of the calculation on each row of the data at run-time
For example:
`ucount(month(value("Order Date")))`returns the number of months found in the "Order Date" column
`ucount(value("Customer"))` is equivalent to `dimcount("Customer")`
`ucount(period("gregorian month", value("Sold Date")))` returns the number of months represented by dates in the "Sold Date" column
See also:
Mentioned in:


