This topic presents examples of code snippets and Dive scripts, in no particular order.
In many cases, the example includes a screen capture of sample data to illustrate the dive window.
A basic dive includes a dimension and some columns from a cPlan.
dive {
  cplan "/common/basic.cplan"
  window {
    dimension "Color"
    column "Value"
    column "Weight"
  }
}

A dive with no dimensions produces a single row which summarizes the entire data set. This is a good way to produce an overall total for an indicator portlet in DivePort.
dive {
  cplan "/common/basic.cplan"
  window {
    column "Value"
    column "Weight"
  }
}

The cPlan can be created in the dive by naming the cBase and specifying calculations in the Dive script.
dive {
  cplan {
    input "/common/basic.cbase"
    calc "Ratio" `sum(value("Value") / value("Weight"))`
  }
  window {
    dimension "Color"
    column "Ratio"
  }
}

A jump tag transitions a Dive file from one cPlan to another, filtering the new window based on dimension values present in the previous window. Any parent window, that is, any window but the last one, can have a jump tag in it.
For example, you might want to know the top ten Salespersons in an orders cPlan and then view those same Salespersons in an expenses cPlan. This example shows how to declare the jump between the two windows.
dive {
    cplan "orders.cplan"
    window {
      dimension "Salesperson"
      column "Revenue"
      sort {
        column "Revenue" reverse=true
      }
      filter `row_number() <= 10`
    }
    jump {
      cplan "expenses.cplan"
    }
    window {
      dimension "Salesperson"
      column "Expenses"
    }
  }
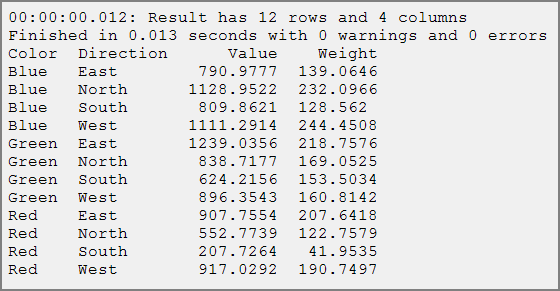
Multitab dives are specified by supplying more than one dimension. The following example produces a two-dimensional multitab, first by Color then by Direction:
dive {
  cplan "/common/basic.cplan"
  window {
    dimension "Color"
    dimension "Direction"
    column "Value"
    column "Weight"
  }
}
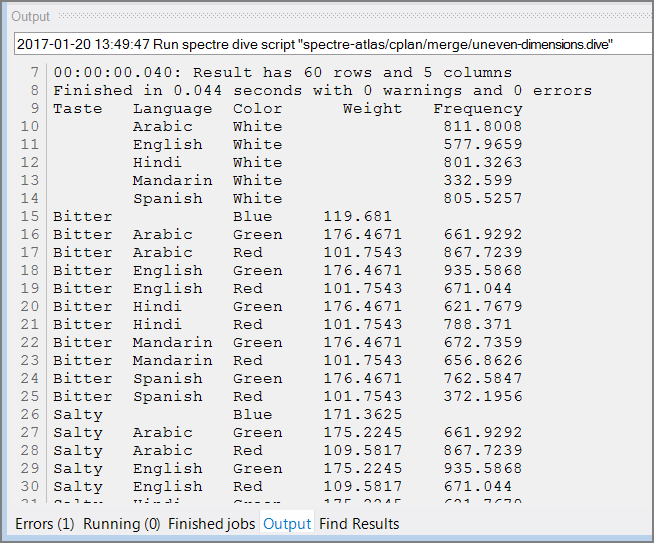
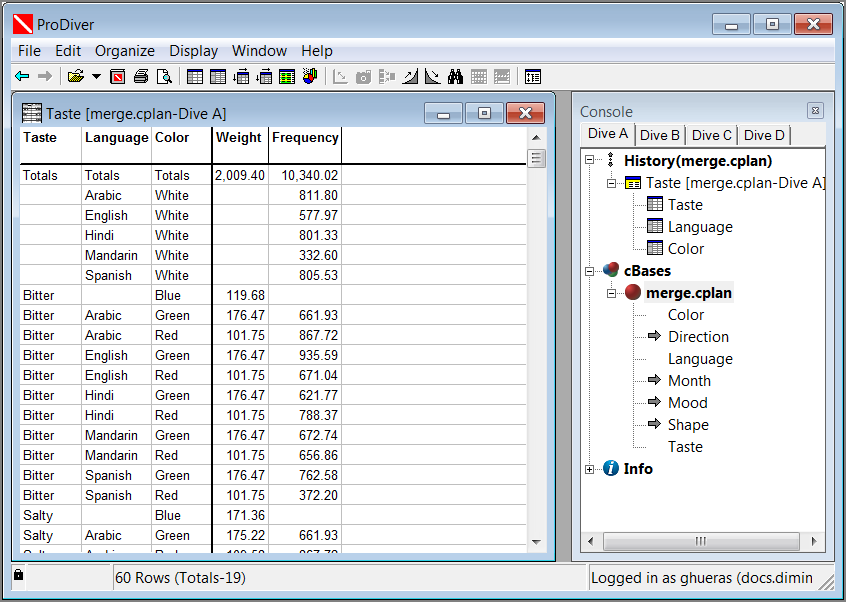
We can perform a multitab on a set of dimensions which are spread across two cBases named in one cPlan. In this example, Taste and Weight are present only in basic.cbase, and Language and Frequency are present only in one.cbase. These cBases are multi-leveled in the cPlan. This produces duplicate values. For instance, the rows for (Bitter, Arabic, Green) and (Salty, Arabic, Green) both have Frequency 661.9292, because they differ only in Taste, and Taste and Frequency do not occur in the same cBase.
These duplications do not affect the totals row, however.
dive {
  cplan "merge.cplan"
  window {
    dimension "Taste"
    dimension "Language"
    dimension "Color"

    column "Weight"
    column "Frequency"

    aux-table "Totals"
  }
}
The ![]() Dive results:
Dive results:
The multitab in ![]() ProDiver:
ProDiver:
A dive that sorts the data and filters on the row number can present a "Top n" list.
dive {
  cplan "/cplans/revenue.cplan"
  window {
    dimension "Salesperson"
    column "Net Sales"
    sort {
      column "Net Sales" reverse=true
    }
      filter `row_number() <= 10`
  }
}
When multiple windows are specified in a dive, the last window is the output. The windows before the last one are parent windows, which affect the output by filtering the rows used by the last window. When a summarized row is filtered out of a parent window, the corresponding detail rows are filtered out of the output. In this example, the final window summarizes only the rows that are not filtered out by the previous window. That is, only the rows that contribute to the top 3 moods by weight window are used.
dive {
  cplan "/common/basic.cplan"
  window {
    dimension "Mood"
    column "Weight"
    sort {
      column "Weight" reverse=true
    }
    filter `row_number() <= 3`
  }
  window {
dimension "Mood"
    dimension "Color"
    column "Value"
    column "Weight"
  }
}

CrossTabs are created by specifying at least one dimension and at least one column in the cross block.
dive {
  cplan "/common/basic.cplan"
  window {
    dimension "Color"
    cross {
      dimension "Direction"
      column "Value"
    }
  }
}

Regular summaries can appear in a CrossTab in addition to cross summaries. Specify the columns outside the cross block, and the columns are not summarized by the cross dimension.
dive {
  cplan "/common/basic.cplan"
  window {
    dimension "Color"
    cross {
      dimension "Direction"
      column "Value"
    }
    column "Value"
    column "Weight"
  }
}

CrossTabs with multiple dimensions and summaries listed in the cross block result in a MultiCrossTab display.
dive {
  cplan "/common/basic.cplan"
  window {
    dimension "Mood"
    cross {
      dimension "Color"
      dimension "Direction"
      column "Value"
      column "Weight"
    }
  }
}

You can add summaries outside the cross tab area. For example:
dive {
  cplan "/common/basic.cplan"
  window {
    dimension "Color"
    cross {
      dimension "Direction"
      column "Value"
    }
    column "Value"
    column "Weight"
  }
}

This dive on Sales Region, with columns sum(value("Revenue")) and rank(sum(value("Revenue"))) gives ranking of Sales Regions by Revenue. Adding the filter on North and Southwest preserves the rank column numbering. Grouping and diving again recalculates the rank.
dive {
  cplan {
    input "/common/demo_drl.cbase"
    calc "rank" `rank(sum(value("Revenue")))`
  }
  window {
    dimension "Sales Region"
    column "Revenue"
    column "rank"
    filter `is_in(value("Sales Region"), "North", "Southwest")`
    aux-table "Totals"
  }
}
The aux-table tag can be used to include totals in the window.
dive {
  cplan "/common/basic.cplan"
  window {
    dimension "Color"
    cross {
      dimension "Direction"
      column "Value"
    }
    column "Value" {
      property "Label" "Totals"
    }
    aux-table "Totals"
  }
}

The aux-table tag can also be used to filter data and compute an "others" row.
dive {
  cplan "/common/basic.cplan"
  window {
    dimension "Mood"
    column "Value"

    aux-table "Others" filter=`value("Value") <= 1600`
    filter `value("Value") > 1600`
  }
}

The aux-table tag can be used to present a total, filter the data, and present the filtered total, all in one window.
dive {
  cplan "/common/basic.cplan"
  window {
    dimension "Mood"
    column "Value"

    aux-table "Pre-Totals"

    filter `value("Value") > 1600`

    aux-table "Post-Totals"
  }
}

Subtotals are created by specifying the dimensions that you want in the aux-table block.
dive {
  cplan "/common/basic.cplan"
  window {
    dimension "Color"
    dimension "Taste"
    column "Value"

    aux-table "Subtotal" {
      dimension "Color"
    }
    aux-table "Total"
  }
}
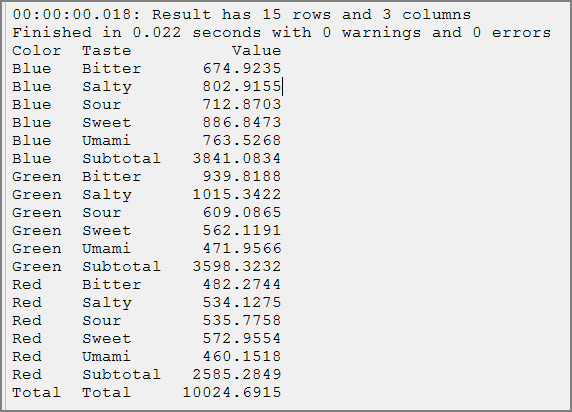
In this example, named-group-values.cplan defines the group "Northeast" as the directions North and East.
cplan {
  input "/common/basic.cbase"

  dimension "Direction" {
    group "Northeast" "North" "East"
  }
}
dive {
cplan "named-group-values.cplan"
window {
dimension "Direction"
column "Value"
group "Direction" "Northeast"
}
}

This Dive shows where to rename columns in the window.
dive {
  cplan "/repository/base_star_charges.cplan"
  filter `is_in_list(value("Entity ID"), "M,K,P,C,G")`
  window {
    dimension "Entity ID"
    dimension "Posting Date"
    dimension "Dept ID"
    column "Charge Dollars"
    rename "Posting Date" "Transaction Date"
  }
}
This Dive shows the default format and an accounting style presentation for negative numbers.
dive {
cplan "/data/numbers.cplan"
window {
dimension "object" label="Categories"
column "sales"
column "profit"
column "profit" format="$#,#;\"$\"(#,#)" label="as dollars"
column "profit" format="$#,#.00;\"$\"(#,#.00)" label="accounting style"
}
}

This example shows how to specify sorting in the dive window.
dive {
  cplan "demo_drl.cplan"
  window {
    dimension "Sales Region"
    column "Plan Units"
    sort {
      column "Plan Units" reverse=true
    }
  }
}
It is possible in certain cases to sort with subtotals. Each sort performed in the dive window must be compatible with every aux-table in that same dive window. To be compatible, the sort must start with all of the dimensions in the aux-table, in window order. For example, the following dive window works:
dive { cplan "demo_abc.cplan"
window {
dimension "A"
dimension "B"
dimension "C"
column "X"
sort {
column "A"
column "B" reverse=true
column "X"
}
aux-table "Subtotal" {
dimension "A"
}
aux-table "Subtotal" {
dimension "B"
dimension "A"
}
}
}
The sort is compatible with the first subtotal table because it starts with "A", and it is compatible with the second subtotal table because it starts with "A" and "B" (using the order given by the window's dimensions).
Calcs defined in the cPlan can be accessed in the Dive.
dive {
  cplan {
    input "add-row-number.cbase"
    calc "Min Row Number" `min(value("Row Number"))`
    calc "Max Row Number" `max(value("Row Number"))`
  }
  window {
    dimension "Mood"
    dimension "Taste"
    column "Min Row Number"
    column "Max Row Number"
  }
}
Using the Integrator Squash process object, you can calculate min, max, average, and standard deviation. You can use a dive with Spectre to do the same. A dive can calculate multiple summaries at the same time by defining the calculations in the cplan block. For example:
dive {
  cplan {
    text-input "test.txt"
    calc "X Min" `min(value("X"))`
    calc "X Max" `max(value("X"))`
    calc "X Average" `average(value("X"))`
    calc "X Stddev" `stddev(value("X"))`
  }
  window {
    dimension "Region"
    column "X Min"
    column "X Max"
    column "X Average"
    column "X Stddev"
  }
}
This dive filters the dive window and then determines the number of rows remaining. It uses both row-count() and row_number().
dive {
  cplan {
    cbase-input "basic.cbase"
  }
  window {
    dimension "Mood"
    filter `row_number() <= 3`
    add "new count" `row_count()`
    add "is last row" `row_number() = row_count()`
  }
}
The cBase:
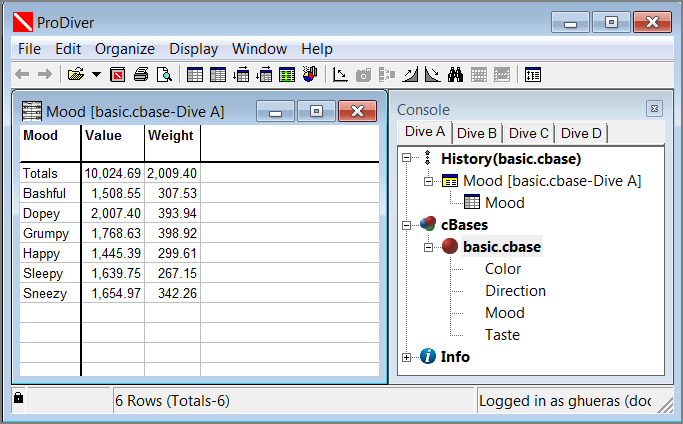
The results:

If you add another filter, filter `row_number() = row_count()`, then the dive window is reduced to one row (Grumpy).
The demo-drs.cbase in this example has rows for each order associated with the customers. This filter displays a dive window with customers that have more than 10 orders.
dive {
  cplan {
    cbase-input "/Spectre-TestData/demo_drs/demo_drs.cbase"
    calc "rowcount" `count()`
  }
  window {
    dimension "Customer"
    column "rowcount"
    filter `value("rowcount") >10`
  }
}
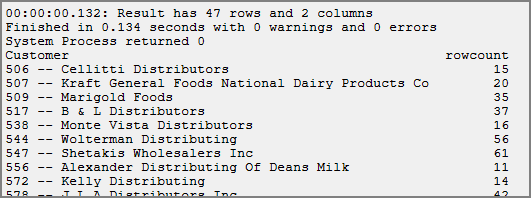
TIP: This window filter could use a compound expression.
In a Dive, the working set is everything outside the window{} tag. For example:
dive{
  cplan {
    cbase-input "bla.cbase" {
      filter `"A"`
    }
    filter `"B"`
  }
  filter `"C"`
  window {
    filter `"D"`
    dimension "bla"
  }
}
In this example, filters A, B and C are applied to create the working set. Filter D is not applied because it is referenced inside the window.
Here's an example of using a Dive in a lookup to compute the first 3 days of two different time ranges. The dive computes, for each date, whether that date is in the current month-to-date, and one of the first 3 dates in that range. The details are in the cPlan.
dive {
  cplan "test.cplan"
  window {
    dimension "Date"
  }
}
cplan {
text-input "data.txt" {
lookup {
dive-input {
dive {
cplan {
text-input "data.txt"
calc "Today" `date("2018/02/21")`
calc "First 3 This Month" `row_number() <= 3`
filter `mtd(value("Date"), calc("Today"))`
}
window {
dimension "Date"
column "First 3 This Month"
}
}
}
key "Date" "Date"
}
lookup {
dive-input {
dive {
cplan {
text-input "data.txt"
calc "Today" `date("2018/02/21")`
calc "First 3 Same Month Last Year" `row_number() <= 3`
filter `lymtd(value("Date"), calc("Today"))`
}
window {
dimension "Date"
column "First 3 Same Month Last Year"
}
}
}
key "Date" "Date"
}
}
filter `value("First 3 This Month") or value("First 3 Same Month Last Year")`
}
Consider the data:
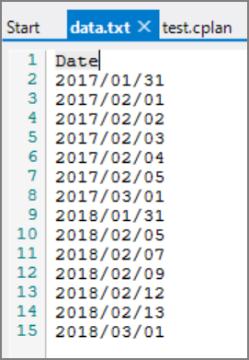
And the results of the Dive using the cPlan with the lookups:

You can use the spectre cplaninfo command line tool to save metadata about a cPlan. This Dive specifies a window into that data.
dive {
  cplan "metadata.cplan"
  window {
    dimension "Name"
    dimension "Label"
    dimension "Description"
    dimension "Definition"
    dimension "Path"
    dimension "Origin"
    dimension "Format"
    dimension "Automatically Generated"
    dimension "Column Type"
  }
}
In this example, parameters are handled by the cPlan and referenced in the window.
dive {
  take-parameter "Column1"
  take-parameter "Dimension" default="Color"
  cplan "/cplan/parameters.cplan" {
    pass-parameter "Column1"
    pass-parameter "Column2" "Weight"
  }
  window {
    dimension "$(Dimension)"
    column "Column1"
    column "Column2"
  }
}
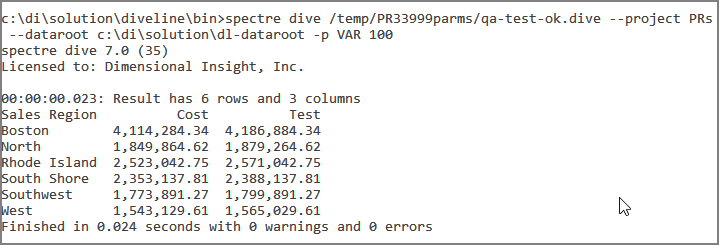
Best practice is to declare parameters before passing them along. For example, here the dive is called with the VAR parameter, which is passed into the cPlan:
dive {
  take-parameter "VAR"
  cplan "qa-paramtest.cplan" {
    pass-parameter "VAR"
  }

  window {
    dimension "Sales Region"
    column "Cost"
    column "Test"
  }
}
Here the cPlan declares the VAR parameter before using it in the calc.
cplan {
cbase-input "/cbases/demo_drs.cbase"
take-parameter "VAR"
calc "Test" `sum(value("Cost") + parse_integer(param("VAR")))`
}
This snippet adds a summary column to the window to display the average count per dimension value. A second summary column displays the average over the entire cBase.
dive {
  cplan "/client_files/charges.cplan" {
  }
  window {
    dimension "ChargePOS"
    column "CPT Count"
    column "average_cnt" `average(value("CPT Count"))`
    column "average_all" `top(average(value("CPT Count")))`
  }
}
dive {
cplan {
input "/cbases/dairy.cbase"
window {
dimension "Sales Region"
dimension "Product Family"
column "X" `100.0 * calc("Revenue") / squash_right(calc("Revenue"), 1)`
aux-table "Subtotal" {
dimension "Sales Region"
}
}
}
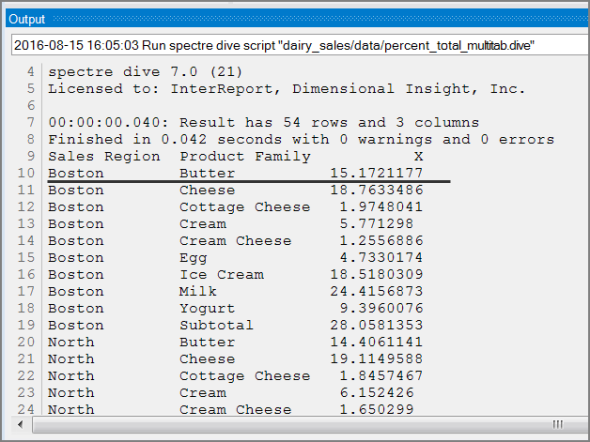
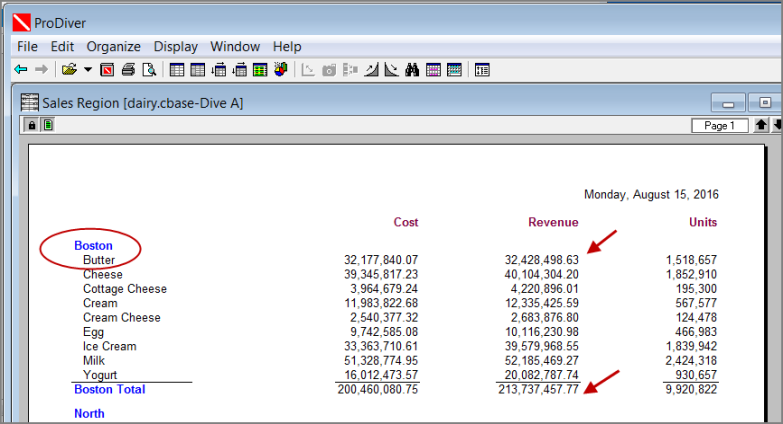
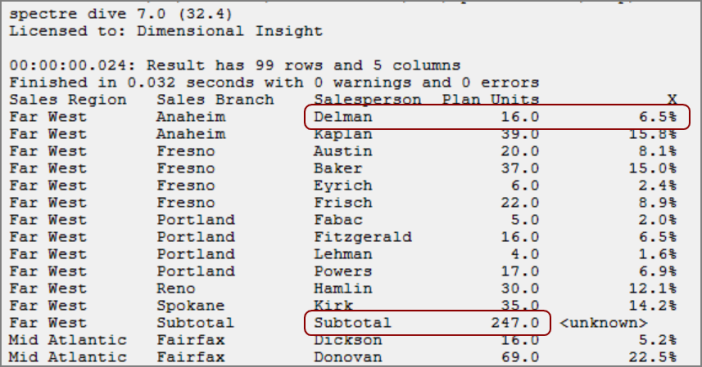
Multiple dimensions in a Dive window create a subtotaling effect. The squash_right() function allows you to access the subtotal value and use it in a calculation. For example:
dive {
  cplan {
    cbase-input "/cbases/demo-sales.cbase"
    calc "X" `100.0 * calc("Plan Units") / squash_right(calc("Plan Units"),2)`
  }
  window {
    dimension "Sales Region"
    dimension "Sales Branch"
    dimension "Salesperson"
    column "Plan Units"
    column "X" format="#,0.0\\%"
    aux-table "Subtotal" {
      dimension "Sales Region"
    }
  }
}
Here you can see that Salesperson Delman's 16 Plan Units are approximately 6.5% of the 247 Plan Units for the Far West Sales Region.
This example filters the data based on the parameter value (FilterDepot) matching the column value (Depot).
dive {
  cplan "MyCplan.cplan"
  take-parameter "FilterDepot" selection=true {
    default-all-values
  }
  window {
    dimension "Depot"
    filter `param_match("FilterDepot", "Depot")`
  }
}
Tags for dimension and columns are processed, and data is generated internally, before all other operations in a window, which are then processed sequentially. This dive includes a calculation and sort before adding a final row number.
dive {
  cplan {
    input "/cbases/commodities.cbase"
    calc "Cumulative Sales" `previous(calc("Cumulative Sales"), 0) + calc("Sales")`
  }
  window {
    dimension "Ship Date"
    dimension "Commodity"
    column "Sales"
    column "Cumulative Sales"
    sort {
      column "Ship Date"
      column "Commodity"
    }
    add "Row" `row_number()`
  }
}
The functionality of Integrator's Break object can be replicated in a Spectre Dive by using the within tag. This example produces four different columns that can be used to break on the rows of data.
dive {
  cplan {
    cbase-input "/cbases/sales.cbase"
  }
  window {
    dimension "Product Class"
    dimension "Ship Month"
    within "Product Class" {
      sort {
        column "Ship Month"
      }
      add "Index" `row_number()`
      add "First" `row_number() = 1`
      add "Last" `row_number() = row_count()`
      add "Level" `row_number() != row_count()`
    }
  }
}
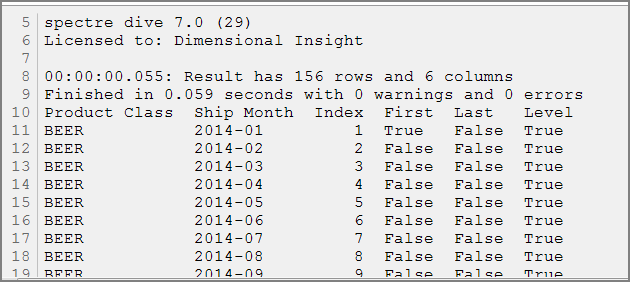
A DivePort client that is licensed for Measure Factory passes a parameter to a Dive file when selected for the Measure portlet type. The parameter __mf_measure makes the metadata associated with a specific measure available to the portlet. For example:
dive {
  take-parameter "__mf_measure" {
    default "Total Admissions"
  }
  cplan {
    cbase-input "factory-info/measure-dimensions-info.cbase" {
      filter `value("Measure") = param("__mf_measure")`
      filter `value("Analysis") = "Custom"`
    }
  }
  window {
    dimension "Dimension Order"
    dimension "Dimension"
  }
}
Select the dive in a Measures Portlet, and show the Dimension column.
NOTE: The Dive file needs to be located in a different project from the factory project. The project with the dive file requires an alias into the factory project, so that the Dive can reach the info cBases.
Suppose you have a DivePort page with a portlet that has a row-scoped pop-up cross-link click-action that targets a second portlet. Certain steps must be taken for the popped-up window to be filtered by the dimension value selected on the clicked portlet. With ProDiver markers, this is accomplished by having a QuickView or parent window in the marker to receive the passed-in value. With a Dive file, you need to declare parameters matching the names of the dimensions whose values are to be received. This is akin to declaring matching QuickViews in a marker. In the dive case, however, you have explicit control over what to do with the passed-in value. For example, you can use it as a filter:
dive {
  take-parameter "Sales Region" selection=true {
    default-all-values
  }

  cplan "/path/to/my.cplan"

  filter `param_match("Sales Region")`

  window {
    ...
  }
}
When used without passing a parameter, this example performs no filtering because all values is the default. When a parameter is passed in, it filters a column named Sales Region by using the parameter with the same name.
If the column to filter is not named the same as the parameter, specify the column name as the optional second parameter to param_match(). Note that param_match() is more clever than just using equal to compare values, since it handles multiple values, all-values, and values that are the names of named groups.
The cPlan itself could be parameterized, and the Sales Region value could be passed into the cPlan if desired.
This dive passes three parameter values to a cPlan to filter source data.
dive {
  take-parameter "Sales Team" default="Team Alpha"
  take-parameter "Sales Manager" default="Benett, Keith [205]"
  take-parameter "Brand" default="BACARDI BREEZER"

  cplan "sales_rates_comparison.cplan" {
    pass-parameter "Sales Team" "$(Sales Team)"
    pass-parameter "Sales Manager" "$(Sales Manager)"
    pass-parameter "Brand" "$(Brand)"
  }

  window {
    dimension "Ship Month"
    column "Filtered Revenue"
    column "Filtered Cost"
    column "Rate FILTERED"
    column "ALL Revenue"
    column "ALL Cost"
    column "Rate ALL"
    aux-table "Totals"
  }
}
See also:
