Grid Code Samples
The following examples show how you can use a grid in DiveTab.
 A Basic Example
Here is an  example of grid blocks in an overview page:
  sections {
    overview-page {
      title "Overview 1"
      cplan "/cplans/basic_101.cplan"

      tab "Grid 1" {
        screen {
          layout {
            vsplit {
              hsplit {
                spacer percent = 10
                grid percent = 20 {
                  row
                  row "Corporate Supplier"
                  row "Beverage Type"
                  row "Corporate Product Group"
                }
                line percent = 1
                grid percent = 5 {
                  row
                  row {
                    text column = "Corporate Supplier Count"
                  }
                  row {
                    text column = "Beverage Type Count"
                  }
                  row {
                    text column = "Corporate Product Group Count"
                  }
                }
              }
            }
          }
        }
      }
    }
  }
Here is the  result of the code in DiveTab.
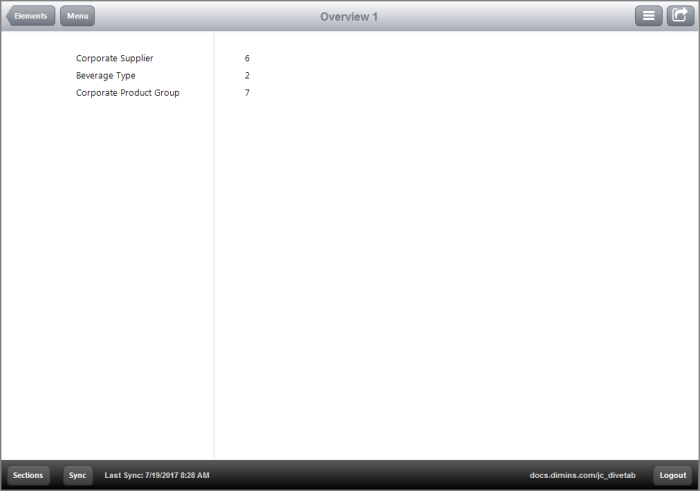
Notice how there are no dividing lines unless specifically stated in the code.
 An Example Using a Vsplit Within an Hsplit Tag
The  following example uses a vsplit tag within an hsplit tag, which changes the grid alignments.
  sections {
    overview-page {
      title "Overview 2"
      cplan "/cplans/basic_101.cplan"

      tab "Grid 2" {
        screen {
          layout {
            hsplit {
              spacer percent = 20
              vsplit percent = 20 {
                spacer percent = 10

                grid percent = 15 {
                  row "Corporate Supplier"
                  row {
                    text column = "Corporate Supplier Count" {
                      link {
                        page id = "rp-1"
                      }
                    }
                  }
                }
                spacer percent = 1

                grid percent = 15 {
                  row "Beverage Type"
                  row {
                    text column = "Beverage Type Count" {
                      link {
                        page id = "rp-2"
                      }
                    }
                  }
                }
                spacer percent = 1

                grid percent = 15 {
                  row "Corporate Product Group"
                  row {
                    text column = "Corporate Product Group Count" {
                      link {
                        page id = "rp-3"
                      }
                    }
                  }
                }
              }
            }
          }
        }
      }
    }
  }

  pages {
    report-page id = "rp-1" {
      title "Corporate Supplier"
      cplan "/cplans/basic_101.cplan"
      dimension "Corporate Supplier"
      text column = "Cost"
      text column = "Cases"
    }

    report-page id = "rp-2" {
      title "Beverage Type"
      cplan "/cplans/basic_101.cplan"
      dimension "Beverage Type"
      text column = "Cost"
      text column = "Cases"
    }

    report-page id = "rp-3" {
      title "Corporate Product Group"
      cplan "/cplans/basic_101.cplan"
      dimension "Corporate Product Group"
      text column = "Cost"
      text column = "Cases"
    }
  }
Here is the  result of the code in DiveTab.
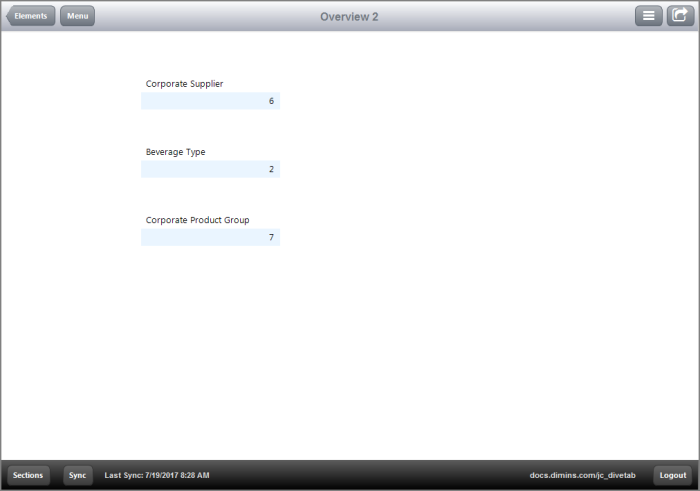
Notice the alignment of rows. This is because a vsplit tag is used within a hsplit tag instead of vice versa; this causes the elements to be organized horizontally, top to bottom, instead of vertically, left to right. The order of nesting for the vsplit and hsplit tags changes the way the grids are organized and adjustments are needed to display correctly.
Also notice how some rows are a light blue; this indicates that they are linked.
 An Example Using an Elements Block
The  following example includes grid blocks with some rows linked to Report pages, within an elements block.
  sections {
    overview-page {
      title "Overview 3"
      cplan "/cplans/basic_101.cplan"

      tab "Grid 3" {
        screen {
          layout {
            vsplit {
              hsplit percent = 10
              hsplit {
                spacer percent = 10
                element id = "grid" percent = 20
                spacer percent = 2
                element id = "grid2" percent = 20
              }
            }
          }
        }
      }

      elements {
        grid id = "grid" {
          row "Corporate Supplier"
          row "Beverage Type"
          row "Corporate Product Group"
        }

        grid id = "grid2" {
          row {
            text column = "Corporate Supplier Count" {
              link {
                page id = "rp-1"
              }
            }
          }
          row {
            text column = "Beverage Type Count" {
              link {
                page id = "rp-2"
              }
            }
          }
          row {
            text column = "Corporate Product Group Count" {
              link {
                page id = "rp-3"
              }
            }
          }
        }
      }
    }
  }

  pages {
    report-page id = "rp-1" {
      title "Corporate Supplier"
      cplan "/cplans/basic_101.cplan"
      dimension "Corporate Supplier"
      text column = "Cost"
      text column = "Cases"
    }

    report-page id = "rp-2" {
      title "Beverage Type"
      cplan "/cplans/basic_101.cplan"
      dimension "Beverage Type"
      text column = "Cost"
      text column = "Cases"
    }

    report-page id = "rp-3" {
      title "Corporate Product Group"
      cplan "/cplans/basic_101.cplan"
      dimension "Corporate Product Group"
      text column = "Cost"
      text column = "Cases"
    }
  }
Here is the  result of the code in DiveTab.
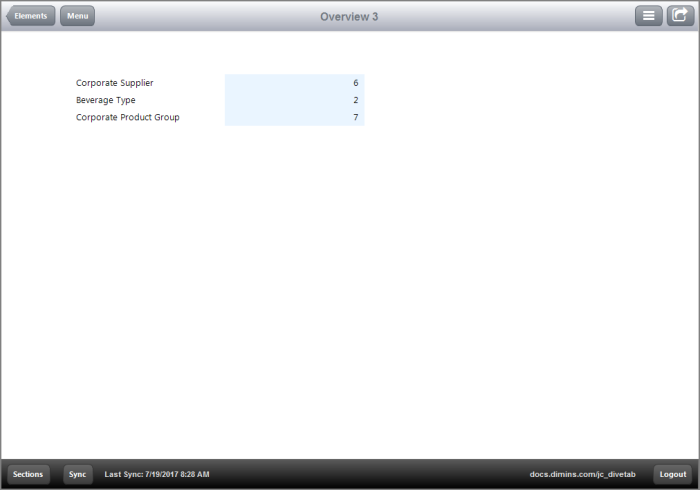
The grid elements are defined in the elements block, identified by using the id tag, and then referenced in the overview-page by using the element id tag.
 An Example that uses Links and a Box Element
The  following code includes several grid blocks within a box block and defined in an elements block.
  sections {
    overview-page {
      title "Overview 4"
      cplan "/cplans/basic_101.cplan"

      tab "Grid 4" {
        screen {
          layout {
            vsplit {
              hsplit percent = 5
              hsplit percent = 50 {
                spacer percent = 30
                box percent = 40 {
                  title "Grid"
                  element id = "grid3" percent = 60
                }
                spacer percent = 30
              }
            }
          }
        }
      }

      elements {
        grid id = "grid3" {
          row {
            text "Corporate Supplier" {
              link {
                page id = "rp-1"
              }
            }
          }
          row
          row {
            text "Beverage Type" {
              link {
                page id = "rp-2"
              }
            }
          }
          row
          row {
            text "Corporate Product Group" {
              link {
                page id = "rp-3"
              }
            }
          }
        }
      }
    }
  }

  pages {
    report-page id = "rp-1" {
      title "Corporate Supplier"
      cplan "/cplans/basic_101.cplan"
      dimension "Corporate Supplier"
      text column = "Cost"
      text column = "Cases"
    }

    report-page id = "rp-2" {
      title "Beverage Type"
      cplan "/cplans/basic_101.cplan"
      dimension "Beverage Type"
      text column = "Cost"
      text column = "Cases"
    }

    report-page id = "rp-3" {
      title "Corporate Product Group"
      cplan "/cplans/basic_101.cplan"
      dimension "Corporate Product Group"
      text column = "Cost"
      text column = "Cases"
    }
  }
Here is the  result of the code in DiveTab.
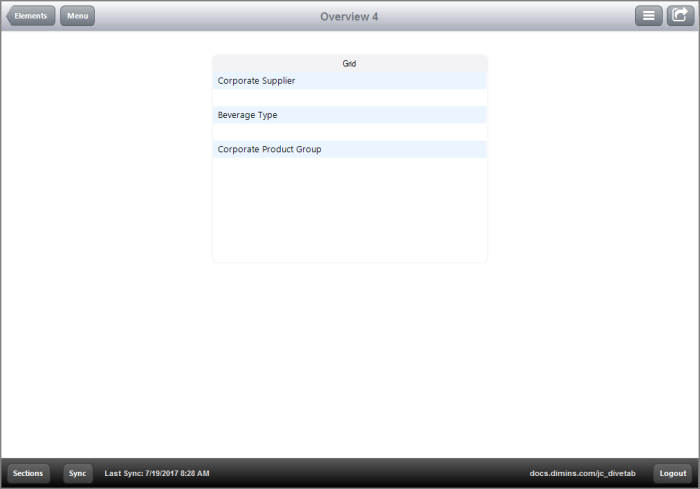
Notice how the named rows are light blue; this indicates that they are linked.
 An Example Using Links, Bullets, and a Background Color
The  following code defines several grid blocks that use a background-color, links, and bullet columns.
  sections {
    overview-page {
      title "Overview 5"
      cplan "/cplans/basic_101.cplan"

      tab "Grid 5" {
        screen {
          layout {
            vsplit {
              spacer percent = 5
              hsplit {
                spacer percent = 10
                grid percent = 20 {
                  row "Corporate Supplier"
                  row "Beverage Type"
                  row "Corporate Product Group"
                  background-color "d0d0d0"
                  border
                }
                spacer percent = 2

                grid percent = 20 {
                  row {
                    text column = "Corporate Supplier Count" {
                      link {
                        page id = "rp-1"
                      }
                    }
                  }
                  row {
                    text column = "Beverage Type Count" {
                      link {
                        page id = "rp-2"
                      }
                    }
                  }
                  row {
                    text column = "Corporate Product Group Count" {
                      link {
                        page id = "rp-3"
                      }
                    }
                  }
                  row {
                    bullet column = "Cost"
                  }
                  row {
                    bullet column = "Cases"
                  }
                }
              }
            }
          }
        }
      }
    }
  }

  pages {
    report-page id = "rp-1" {
      title "Corporate Supplier"
      cplan "/cplans/basic_101.cplan"
      dimension "Corporate Supplier"
      text column = "Cost"
      text column = "Cases"
    }

    report-page id = "rp-2" {
      title "Beverage Type"
      cplan "/cplans/basic_101.cplan"
      dimension "Beverage Type"
      text column = "Cost"
      text column = "Cases"
    }

    report-page id = "rp-3" {
      title "Corporate Product Group"
      cplan "/cplans/basic_101.cplan"
      dimension "Corporate Product Group"
      text column = "Cost"
      text column = "Cases"
    }
  }
Here is the  result of the code in DiveTab.
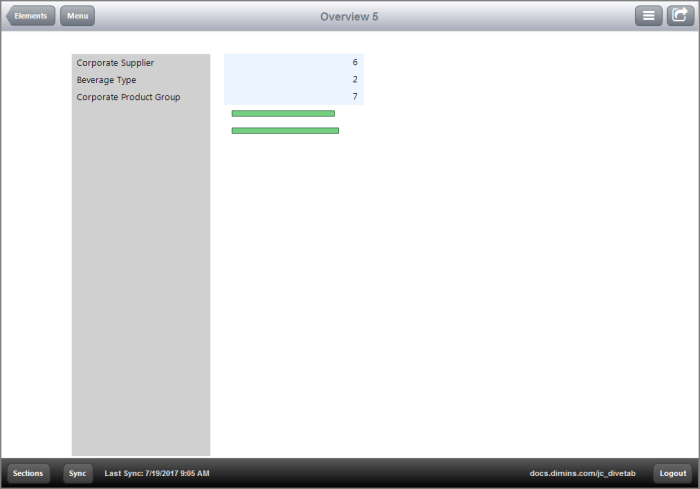
Notice the grid with a gray background. This is achieved by using the background-color tag. The light blue grid is due to links in use rather than a background color. Also notice the use of bullet columns. A row can use a regular text column or instead use an alert column, bullet column, column-set, or image.
See also:
![]() example of grid blocks in an overview page:
example of grid blocks in an overview page:![]() result of the code in DiveTab.
result of the code in DiveTab.![]() following example uses a vsplit tag within an hsplit tag, which changes the grid alignments.
following example uses a vsplit tag within an hsplit tag, which changes the grid alignments.![]() result of the code in DiveTab.
result of the code in DiveTab.![]() following example includes grid blocks with some rows linked to Report pages, within an elements block.
following example includes grid blocks with some rows linked to Report pages, within an elements block. ![]() result of the code in DiveTab.
result of the code in DiveTab.![]() following code includes several grid blocks within a box block and defined in an elements block.
following code includes several grid blocks within a box block and defined in an elements block.![]() result of the code in DiveTab.
result of the code in DiveTab.![]() following code defines several grid blocks that use a background-color, links, and bullet columns.
following code defines several grid blocks that use a background-color, links, and bullet columns.![]() result of the code in DiveTab.
result of the code in DiveTab.


