About Stacked Data Charts
Stacked charts
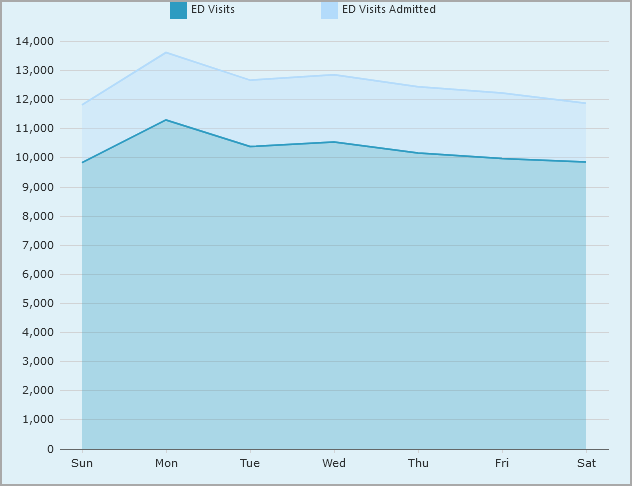
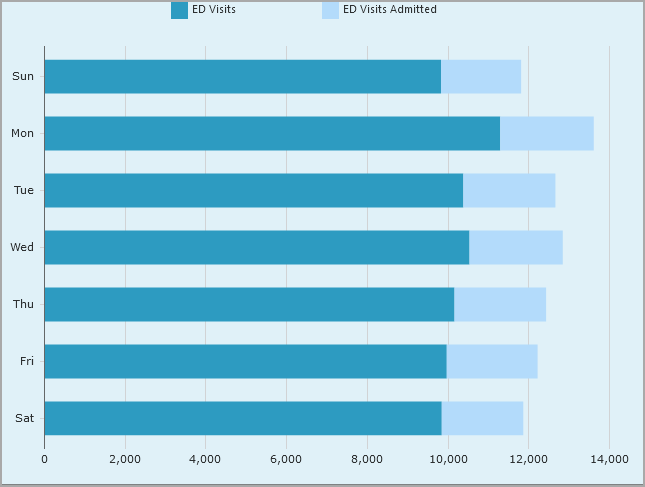
A stacked area, bar, or column chart stacks values on a single bar. The following column chart stacks the number of emergency department visits and the number of emergency department admissions that occurred each day in a week.
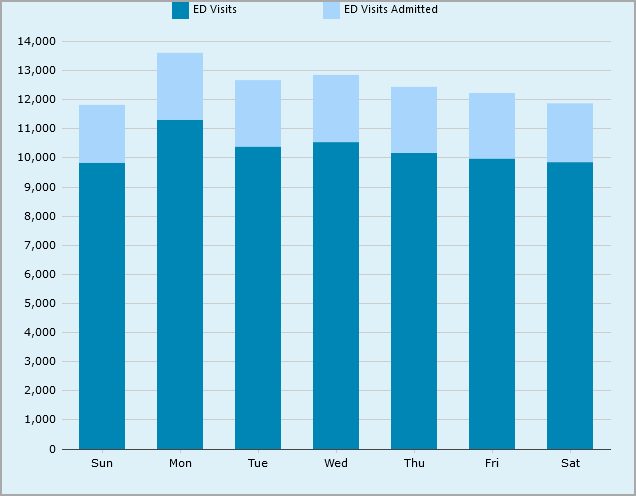
When you create a stacked column chart, you specify:
-
A Dimension (day of week in this example)
-
Two or more measure or summary Values (ED visits and ED visits admitted in this example)
![]() Stacked area and
Stacked area and ![]() stacked bar charts use the same options.
stacked bar charts use the same options.
MultiTab stacked charts
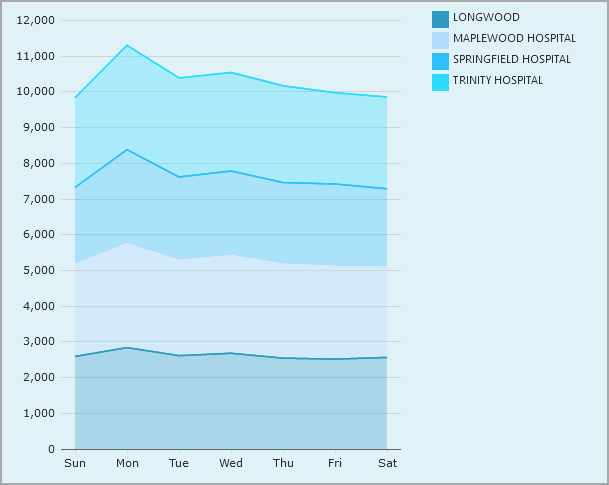
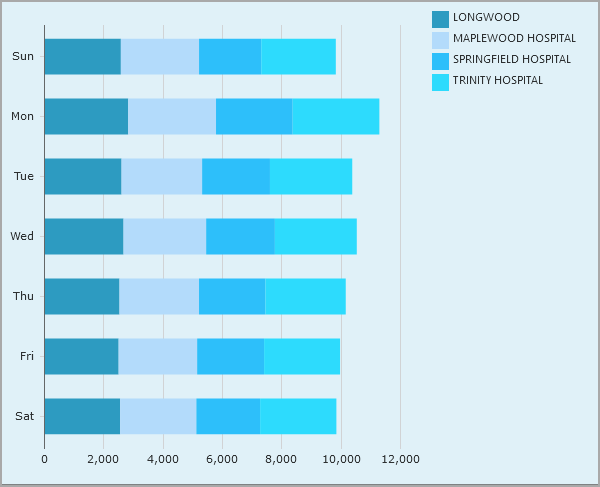
A MultiTab stacked area, bar, or column chart stacks values from a specified category. The following column chart shows the number of emergency department visits to four hospitals that occurred each day in a week.
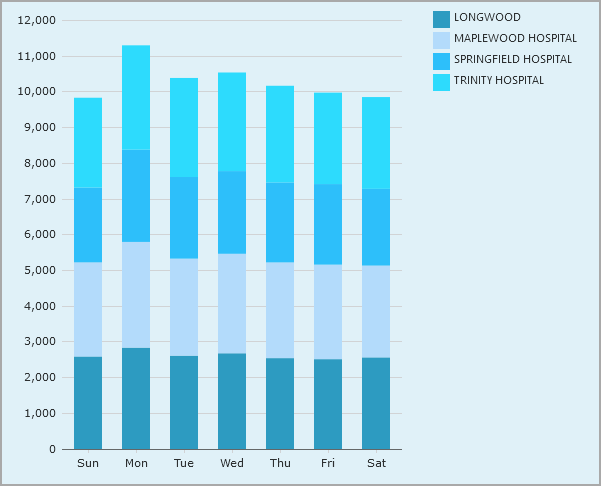
When you create a MultiTab stacked column chart, you specify:
-
A Dimension (day of week in this example)
-
A Category, which is a secondary dimension that divides the primary dimension value into sections (facility in this example)
-
A measure or summary Value (ED visits in this example)
![]() MultiTab stacked area and
MultiTab stacked area and ![]() MultiTab stacked bar charts use the same options.
MultiTab stacked bar charts use the same options.
See also Chart Portlet Options.
