About Control Charts
A control chart is an analysis tool that can be used to identify areas for process and performance improvements. They are available in DivePort 7.2(8) and later. The control chart plots a measurement or an outcome of a process to determine whether quality and processes are being controlled over time. Each chart displays a line for the control data value, a center or average line, and lines for upper and /lower control limits (UCL/LCL) that show the region the value is expected to stay within. The process is determined to be in conrtrolwhen the data values remain in a region defined by a specified set of rules.
Control charts can help you identify times when the process is out of control or otherwise behaving oddly.

DivePort supports attribute control charts for plotting counts or proportions and variable control charts for plotting measurements in a time-ordered sequence.
Attribute control charts (NP, P, C, U) can be used in a situation where each unit in a sample can be nonconforming, or have some unit number of nonconformities. Because the units are counted, all data is non-negative. The process is considered to be in control when the number of nonconformities is stable across time-delineated samples.
Variable control charts (I-MR, Xbar-S, Xbar-R) are for measurable values, and each unit in the sample has a measured number associated with it. This measurement can be negative. The process is considered to be in controlwhen the values are stable across the time-delineated samples.
Control chart options
When you create a control chart, you specify:
- The control chart type (subtype)
- Rules set
- Data mode
- A sample dimension ID
Control chart subtypes
The best type of control chart to use depends on the type of data and the number of units per sample.
| Chart Subtype | Use for: |
|---|---|
| C Chart | Constant sample size. Each unit can have multiple nonconformities. The value is the total number of nonconformities in each sample. |
| NP Chart | Constant sample size. Each unit is a Boolean: either nonconforming or conforming. The value is the number of nonconforming units in each sample. |
| P Chart | Variable sample size. Each unit is a Boolean: either nonconforming or conforming. The value is the percentage of nonconforming units in each sample. |
| U Chart | Variable sample size. - Each unit can have multiple nonconformities. The value is the average number of nonconformities per unit in each sample . |
|
Individual and Moving Range Chart
|
Constant sSample sSize of 1. Two charts are plotted:
|
|
X bar and R Chart
|
Constant sample size. Best suited for sample sizes that have 10 or fewer unitssmall samples, typically fewer than 10 units. Two charts are plotted:
|
|
X bar and S Chart
|
Variable sample size is allowed. Best suited for sample sizes that have 10 or more units. Two charts are plotted:
|
Rules
DivePort uses the following rule sets to determine whether a sample is in control:.
-
Basic Shewhart
-
WECO
-
Nelson
The set of rules that you apply depends on the data. For more information, see About Control Chart Rules.
Data mode
Data modes allow options for different input data, depending on your specific data. Each chart type has one or two data mode options.
For example, there are two ways to configure an NP chart:
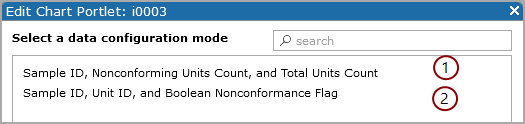
 For the first option, you set:
-
A Sample ID dimension (such as month).
-
An integer specifying the number of nonconforming units (in each month).
-
A second integer specifying the total number of units in each month.
The control chart uses the integers to calculate the upper and lower limits and plot the number of nonconformities for each sample.
 For the second option, you set:
-
Sample ID dimension (such as month).
-
Unit ID dimension (such as day) .
-
A Boolean nonconformance flag that is true for any nonconforming unit.
The control chart calculates the number of nonconforming units in each sample and uses that information to determine the upper and lower control limits.
Reading a control chart
Each chart displays a line for the control data, a center or average line, and upper and lower control limits.
If a value is outside of the UCL/LCL region or otherwise breaks a rule, the data point displays as a red square by default.
Placing a pointer on the chart shows details about the closest data point.
