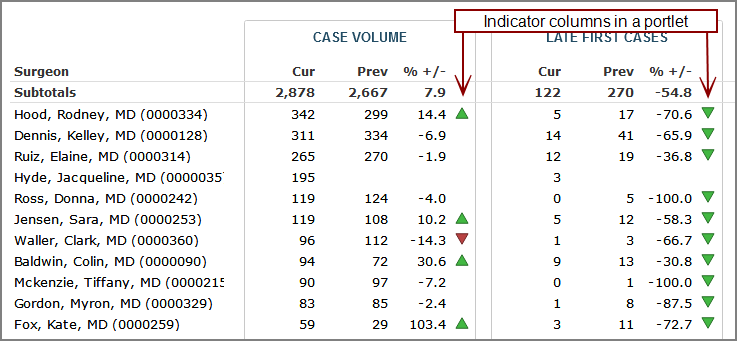
Adding an Indicator Column to a Matrix Portlet
![]() Example.
Example.
NOTE: Matrix portlets require a Measure Factory license.
TIP: When a horizontal indicator is used in a column, space limitations require that the baseline is the only value that is labeled on the axis. Showing the baseline value and not the data value can confuse users. You can prevent the scale from appearing by setting the Axes setting, Hide Axes.
The following procedures describe adding an indicator column to an existing portlet, but you can add one as part of the portlet creation as well.
-
Open the Edit <Portlet Type> Portlet
 dialog box.Remind me how.
- Browse to the page that contains the portlet that you want to edit.
-
On the DivePort toolbar, click Edit to unlock the page and enable edit mode.
- Right-click the portlet that you want to edit, and then on the context menu, click Edit.
-
Click Add a column.
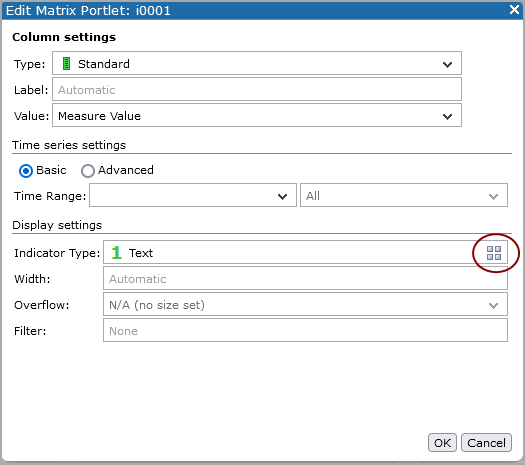
The Column setting
dialog box opens. -
Under Display settings, on the right side of the Indicator Type box, click
 .
.The Display setting page opens.
-
In the Type box, select the indicator type. This example shows the Alert indicator selection.

-
Click Add a threshold.
The Threshold settings page opens.
-
Specify Threshold values, optionally colors, and then click OK.
-
Repeat steps 5 and 6 as necessary.
-
On the Display settings page, select a Shape for the Alert, and then click OK.
- Review the column settings, make any customizations, and then click OK.

The following procedure uses the (IMAGES_URI) macro and assumes that the images that you want to use are in the webdata/dive/customizations/images/ directory.
-
Open the Edit <Portlet Type> Portlet
dialog box.Remind me how.
- Browse to the page that contains the portlet that you want to edit.
-
On the DivePort toolbar, click Edit to unlock the page and enable edit mode.
- Right-click the portlet that you want to edit, and then on the context menu, click Edit.
-
Click Add a column.
The Column setting
dialog box opens. -
Under Display settings, on the right side of the Indicator Type box, click
.The Display setting page opens.
-
In the Type box, select Image.
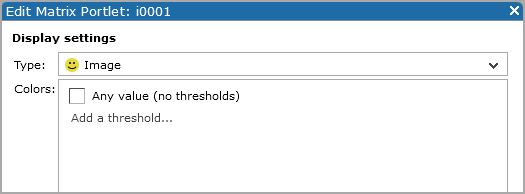
-
Click Add a threshold.
The Threshold settings page opens.
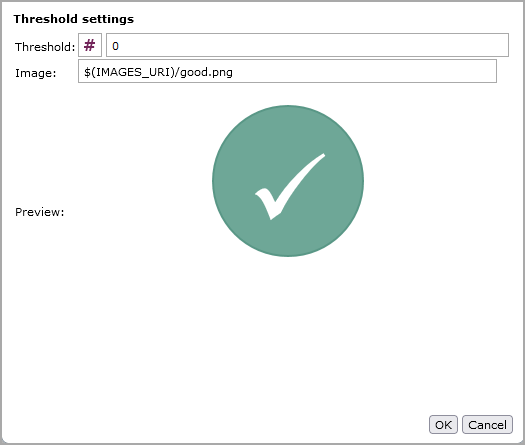
-
Specify a Threshold value and image using the (IMAGES_URI) macro.
-
Verify the image using the preview feature, and then click OK.
-
Repeat steps 5–7 as necessary.
-
Click OK to accept the Display settings.
- Review the column settings, make any customizations, and then click OK.