| Factory project |
Specifies the Measure Factory project that provides the data for the portlet. |
|
Select measures
|
Specifies the measures that display in the left-most portlet column. You can use the Search box to locate specific measures and press and hold Ctrl (Windows) or Command (Mac) while clicking to select multiple measures.
|

|
Opens a  context menu that you can use to sort the list of measures. context menu that you can use to sort the list of measures.

|
|
Lines
|
Specifies the measure factory measures that appear on the left-most  column of the portlet. This option accepts macros. Each line is a row on the tabular portlet. column of the portlet. This option accepts macros. Each line is a row on the tabular portlet.
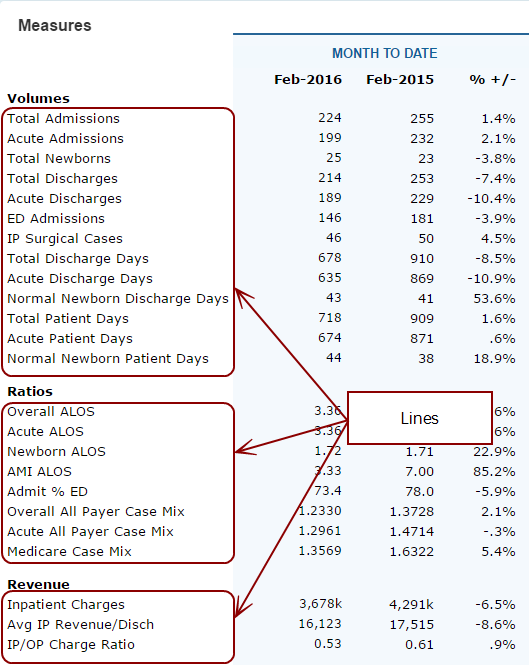
|
|
Line group
|
Specifies the category  label for a group of lines. label for a group of lines.

|
|
Add a line /measure
|
Opens the Select Line Type  dialog box, which you can use to specify the type of line that you want to add. Options are Detail Line, Line, Label, and Page Break. dialog box, which you can use to specify the type of line that you want to add. Options are Detail Line, Line, Label, and Page Break.
NOTE: Labels and page breaks affect the format of the page only. They do not contain data.

 Details Details
| Detail Line |
Opens the Select a dimension dialog box, which you can use to specify a dimension that determines the detailed information that displays.
NOTE: A detail line sorts the line data into classifications based on a specified dimension. For example, an Admission measure standard line could look like this:
| Measure |
YTD |
LYTD |
| Admission |
102 |
96 |
The same Admissions measure could appear as a detail line using the Facility dimension like this:
| Measure |
YTD |
LYTD |
| Facility A |
47 |
45 |
| Facility B |
55 |
51 |
TIP: This option accepts the $(MEASURE_NAME) macro.
|
| Line |
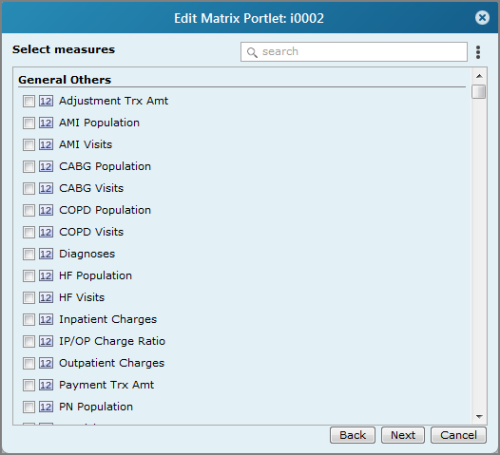
Opens the Select measures  dialog box, which you can use to select the measures that you want to appear as lines on the portlet. This option accepts macros. dialog box, which you can use to select the measures that you want to appear as lines on the portlet. This option accepts macros.
You can click the Menu icon  to select an option to sort the measures list, use the Search box to locate specific measures, and press and hold Ctrl (Windows) or Command (Mac) while clicking to select multiple measures. to select an option to sort the measures list, use the Search box to locate specific measures, and press and hold Ctrl (Windows) or Command (Mac) while clicking to select multiple measures.
|
| Label |
Opens the Line settings  dialog box, which you can use to specify a label Name that you want to include on the portlet. Label lines do not display data. dialog box, which you can use to specify a label Name that you want to include on the portlet. Label lines do not display data.

| Type |
Specifies the type of line. Options are Detail Line, Line, Label, and Page Break. |
| Name |
Specifies the label that displays on the first column of the portlet row. The default, Automatic, displays the name of the measure. |
| Measure |
Applies to detail and standard lines. Specifies the measure that displays on the first column of the line. |
| Dimension |
Applies to detail lines. Specifies a dimension that sorts the measure into classifications. |
| Style |
Specifies a customized style. For information about creating customized line styles, see Workbench Help. |
| Detail style |
Applies to detail lines. Specifies a customized style. For information about creating customized line styles, see Workbench Help. |
| Hide detail total. |
Applies to detail lines. Suppresses the total. |
| Hide if null |
Applies to detail and standard lines. Suppresses null values. |
|
| Page Break |
Inserts a page break on the portlet. Opens the Line settings dialog box, which you can use to add a label Name to the page break location on the portlet. |
After you select a line type, the wizard advances to the Select measures page.
|
|
Add a line /measure group
|
Opens the Line group settings  page, which you can use to specify a label for the line group. page, which you can use to specify a label for the line group.
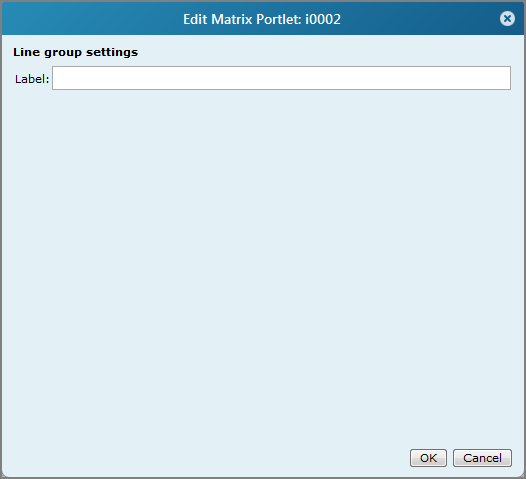
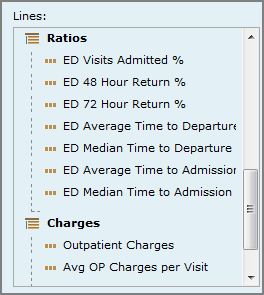
NOTE: After you add a line group, use a drag-and-drop operation to reorder the Lines  list. Place the line labels under the line group label, inside the dotted line. list. Place the line labels under the line group label, inside the dotted line.
|
|
Columns
|
Defines measure data.
The leftmost Measures column is added automatically, and contains the measures that you selected on the Select measures page.

Double-click Measures to open the Measure column settings dialog box, which you can use to customize the following:
| Title |
Specifies the column heading. If left blank, the heading is Measures. |
| Width |
Specifies the column width, in pixels. |
| Overflow |
Available when the column Width is set to something other than Automatic. Specifies the appearance of the display when the column value is wider than the specified column width. The default Ellipses, displays the data in a single row and adds an ellipsis (...) to each cell that overflows the column width. Other options are Wrap text and Wrap text with hanging indent. |
|
|
Add a column
|
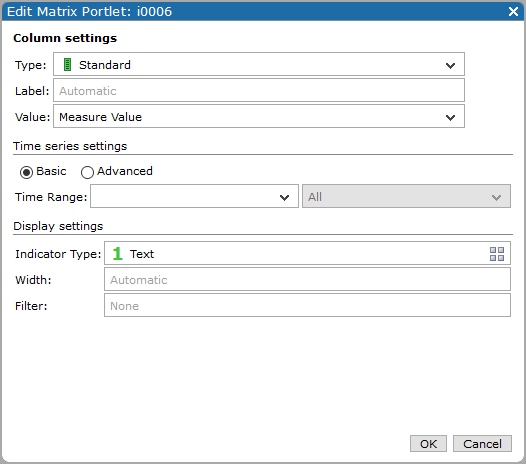
Opens the Column settings  dialog box, which you can use to set options that define the appearance of a new column. dialog box, which you can use to set options that define the appearance of a new column.
 Details Details
| Type |
Specifies the column type. The default is Standard. Other options are:
- Cross—Used for CrossTab or rolling date types of data.
- Comparison—Used for comparing data in a given time period with data in a similar time period.
|
| Label |
Specifies the format for the column label. The default, Automatic, displays the measure-defined value. Typically, you enter the header that you want to display into the label text box. This option accepts macros. Optionally, you can use a data element, but you must escape the data element using braces { }. For example, Year: {YYYY} displays Year: 2021. Use of braces in label strings is limited to:
| YYYY |
Four digit year, standard calendar |
| YY |
Two digit year, standard calendar |
| MMMM |
Long month name, standard calendar |
| MMM |
Abbreviated, three-letter month name, standard calendar |
| MM |
Month number, two-digit, standard calendar |
| M |
Month number, one- or two digit, standard calendar |
| DD |
Two digit calendar day |
| D |
One or two digit day in a standard calendar, or weekday number in an ISO calendar |
| FYYYY |
Year, current selected calendar |
| FMM |
Month number, two-digit, current selected calendar |
| FM |
Month number, one- or two-digit, current selected calendar |
For more information, see Time Series Column Labels.
|
| Auxiliary Measure Value |
Specifies a baseline or goal value that is defined in the measure factory. |
| Time series settings |
Specifies the mode of the time series. Options are Basic and Advanced.
NOTE: Time series options are not supported for cross columns that use date dimensions.
|
|
Time Range
(Basic)
|
Specifies the time range. Options are:
- Year to Date (The first day of the year returns 0)
- Year to Complete Month (The first month of the year returns data for all of last year)
- Quarter to Date (The first day of the quarter returns 0)
- Month to Date (The first day of the month returns 0)
- Week to Date (The first day of the week returns 0)
- Complete Year
- Complete Quarter
- Complete Month
- Complete Week
- Complete Day
- Rolling Year by Month (the last 12 complete months)
- Year
- Future Months
|
|
Time period
(Basic)
|
Specifies the time period. Options are:
- All
- Current
- Previous
- Current Versus Previous
- Current Versus Previous (%)
- Previous Year
- Current Versus Previous Year
- Current Versus Previous Year (%)
|
|
Type
(Advanced)
|
Specifies the type of the time series. Options are To Date, Relative, and Absolute. Advanced features allow further customization of the time period. |
|
To Date
options
|
Uses the specified time range and offset values to define the time series. The default is the current Year to complete Day. Other options are:
- Year to complete Month
- Year to complete Quarter
- Week to complete Day
- Month to complete Day
- Quarter to complete Day
The offset value can adjust the time series by the specified time period. For example, setting the Time Range to Year to complete Day, with an offset of -1 Year, is the equivalent of last year to complete day. Available options for the offset time period are those time periods that are larger than or equal to the first time range.
|
|
Relative
options
|
Uses the specified complete time range and offset values to define the time series. The default is 1 Year, which is the current complete year. Other time period options are:
The offset value can adjust the time series by the specified time period. For example, setting the Time Range to 1 Year, with an offset of -1 Year, is the equivalent of the year before the current complete year. Available options for the offset time period are those time periods that are larger than or equal to the specified time range.
|
|
Absolute
options
|
Uses the specified time range and offset values to define the time series. The default is Month 1 of the current year. The other time period option is Quarter. This option supports custom calendars.
The offset value can adjust the time series by the specified number of years.
|
|
Indicator Type
|
Specifies the type of indicator that displays on the column. The default is Text. Click the Change icon  to select a different type or to set additional display settings. Other types are: to select a different type or to set additional display settings. Other types are:
- Alert
- Horizontal Bullet
- Plus-Minus
- Racetrack
- Rectangle
- Slider
- Slider Light
- Slope
For more information, see Indicator Portlet Options.
|
| Width |
Specifies the column width, in pixels. The default, Automatic uses the data to determine the width. |
| Overflow |
Available when the column Width is set to something other than Automatic. Specifies the appearance of the display when the column value is wider than the specified column width. The default Ellipses, displays the data in a single row and adds an ellipsis (...) to each cell that overflows the column width. Other options are Wrap text and Wrap text with hanging indent.
NOTES:
- If a single word is wider than the column width, the word is truncated to fit.
- This setting does not apply to column headings.
- Placing the pointer on a truncated value opens a tooltip that displays the full value.
|
| Font |
Opens a dialog box which you can use to specify the font, size, and style for the column values.
If a font style is set for both the line and column, the line style is used.
|
| Justification |
Available in DivePort 7.1(32) and later. Specifies which justification for column text to use. Options are Left, Right, and Center.
|
| Filter |
Specifies a Spectre calculation that is used to filter the data that displays in the column. This is a row-level filter.
NOTE: You need to know what expression to type - you cannot refer to measures. However, dimensions can be referred to as `value("Dim")`, and other non-dimensions rules as `value("Rule: RuleName (DataSet)")`.
|
|
|
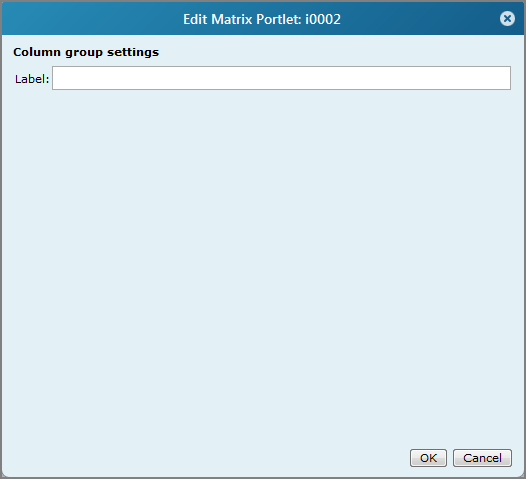
Add a column group
|
Opens the Column group settings  page, which you can use to specify a label for the column group that you want to add. page, which you can use to specify a label for the column group that you want to add.
|
| Threshold Settings |
Click Add a Threshold to open the Threshold settings dialog box, which you can use to set a static threshold value or select a Measure Threshold value, Time Range and period, and indicator Color.
Click the gear icon to right of the Time Range to access the  Advanced time series option. Advanced time series option.

|
Opens the time series mode settings box. Options are Basic and Advanced. Advanced features allow further customization of the time period.
|
| To Date |
Available in advanced mode. Uses the specified time range and offset values to define the time series. The default is the current Year to complete Day. Other options are Year to complete Month, Year to complete Quarter, Week to complete Day, Month to complete Day, and Quarter to complete Day.
The offset value can adjust the time series by the specified time period. For example, setting the Time Range to Year to complete Day, with an offset of -1 Year, is the equivalent of last year to complete day. Available options for the offset time period are those time periods that are larger than or equal to the first time range.
|
| Relative |
Available in advanced mode. Uses the specified complete time range and offset values to define the time series. The default is 1 Year, which is the current complete year. Other time period options are Day, Week, Month, and Quarter.
The offset value can adjust the time series by the specified time period. For example, setting the Time Range to 1 Year, with an offset of -1 Year, is the equivalent of the year before the current complete year. Available options for the offset time period are those time periods that are larger than or equal to the specified time range.
|
| Absolute |
Available in advanced mode. Uses the specified time range and offset values to define the time series. The default is Month 1 of the current year. The other time period option is Quarter. This option supports custom calendars.
The offset value can adjust the time series by the specified number of years.
|
|
| More settings
|
|
Display
|
Opens the Display Settings  page, which you can use to specify sort settings. page, which you can use to specify sort settings.
 Details Details

| Sort By |
Specifies the column to sort by. |
| Sort Up / Sort Down |
Specifies the sort direction. If a direction is not specified, Measures columns sort up and other column types sort down. |
|
|
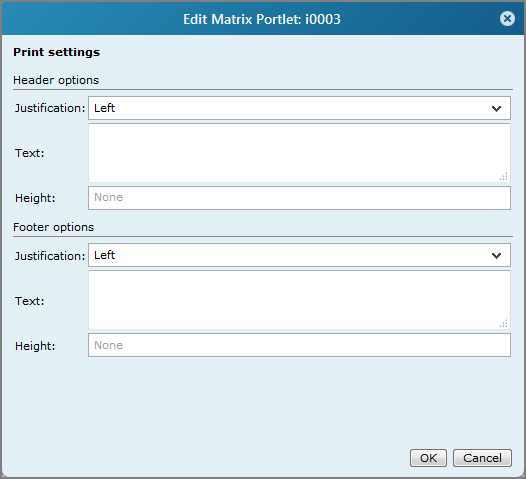
Printing
|
Opens the Print Settings  page, which you can use to set preferences for printed headers and footers. page, which you can use to set preferences for printed headers and footers.
|
|
Column Defaults
|
Available in DivePort 7.1(32) and later. Opens the Column default settings  page, which you can use to set default values for column size (width), overflow, font, and justification. page, which you can use to set default values for column size (width), overflow, font, and justification.

|
| Click Actions |
Opens the Click Actions dialog box, which you can use to Add a click action to the portlet, or Edit or Remove an existing click action. |


 to select a different type or to set additional display settings. Other types are:


