About Combination Charts
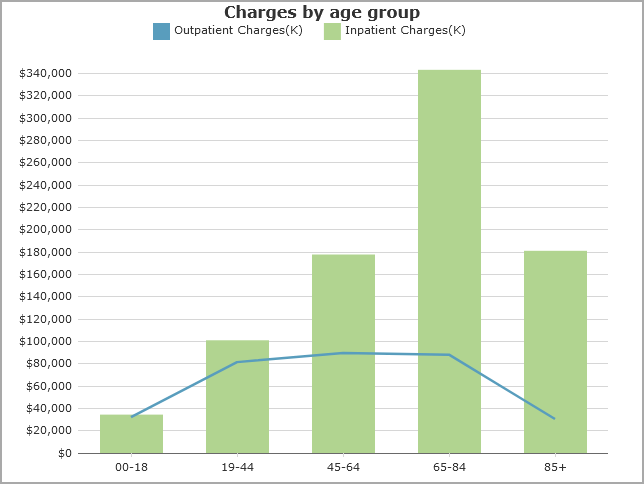
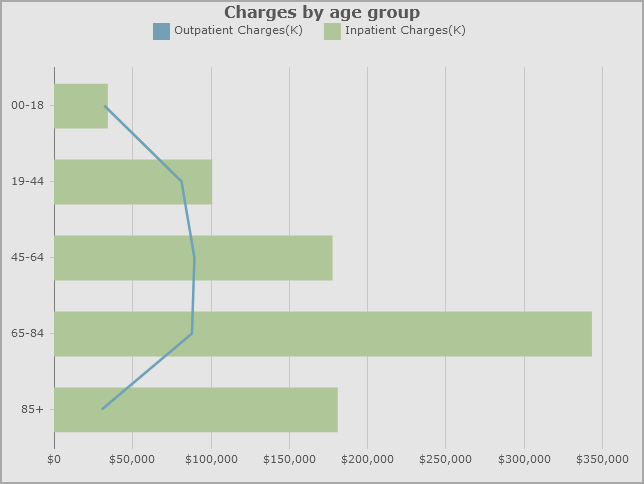
A Combination Chart displays multiple values as superimposed Area, Column, Line, Spline, or Spline Area charts. Example:
Bar charts and area charts can be stacked.
Combination chart options
When you create a combination chart, you specify a column value for each individual chart. DivePort assigns chart colors based on the skin.
For each value, you can customize:
- A label
- Type of chart
- Color and appearance
- Inclusion of statistics (median and mean values)
Vertical combination chart
Reading a combination chart
Placing a pointer within the chart opens a tooltip that shows the numeric data values associated with it.
See also Chart Portlet Options.
Mentioned in: