About Calendar Heatmatrix Charts
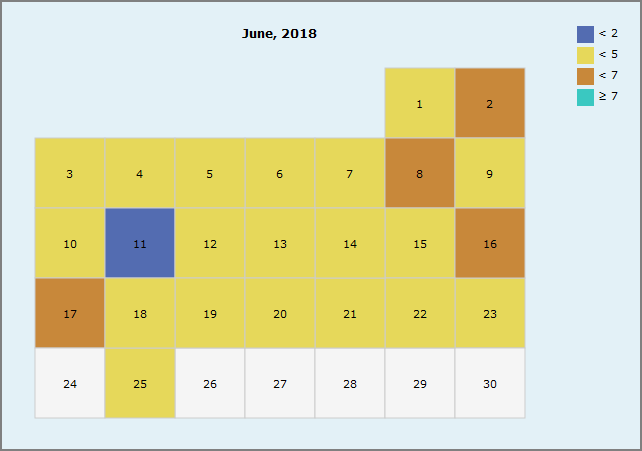
Calendar heatmatrix charts use color on a calendar matrix layout to show date-related data values.
NOTE: DivePort uses the portaldb.xml attribute locale.first-day-of-week for the calendar layout.
Calendar heatmatrix chart options
When you create a calendar
- A date dimension
- A numeric value column
Optionally, you can select:
- A default view for the calendar (month, year, or multi-year)
- Style for a year/multi-year view (grid or linear)
-
If a user can navigate to another view
Legend options allow you to add or omit the legend, as well as specify its location and width.
Color options allow you to specify the type of color scale (gradient, threshold, or binned) and colors used for calendar data.
Text options allow you to specify a title and customize the font.
Reading a calendar heatmatrix chart
Placing a pointer on a calendar day opens a tooltip that shows the date, as well as the dimension label and value.
If navigation is enabled, you can change the calendar:
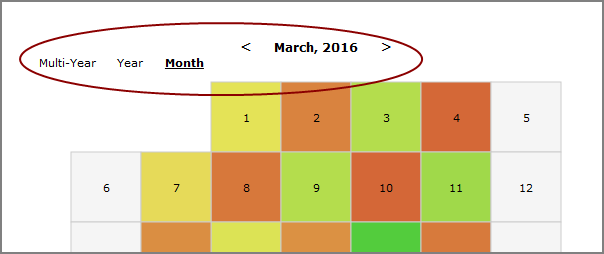
- Click < to see the previous calendar page.
- Click > to see the next calendar page.
- Click a different time view: Multi-year, Year, or Month.
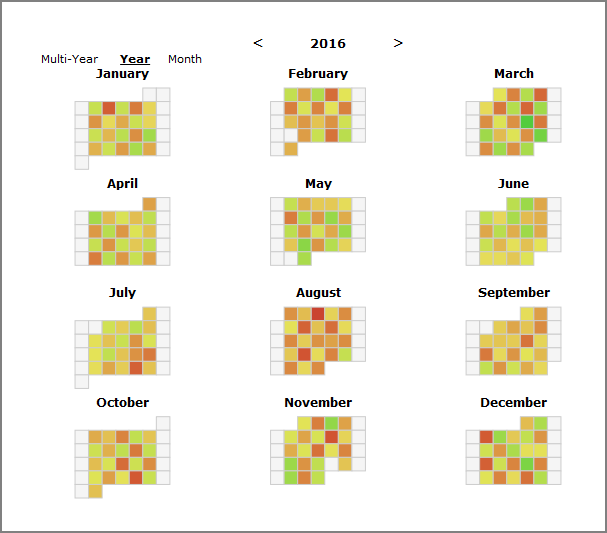
Here is an example of a grid-style year calendar.
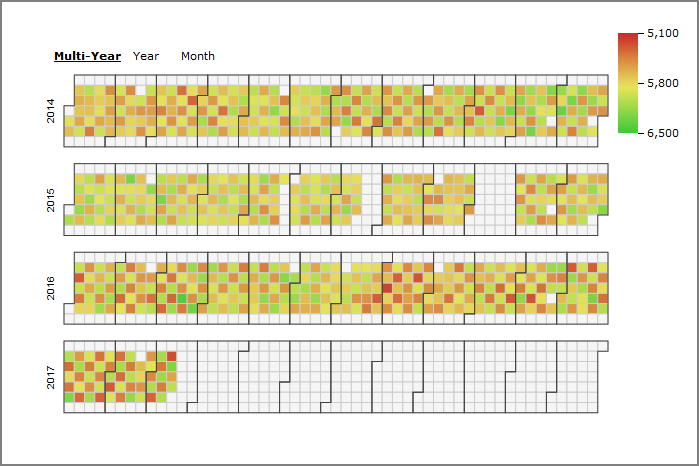
Here is an example of a linear-style multi-year calendar.
See also: