Adding a Matrix Portlet
- In DivePort, browse to the page where you want to add the portlet.
-
On the DivePort toolbar, click Edit to unlock the page and enable edit mode.
The Edit menu item is replaced with edit tools, including a page context menu chevron.
- On the toolbar, click the chevron.
- On the page context menu, click Add a Portlet.
-
On the Add a Portlet page, double-click Matrix
The Edit Matrix Portlet
 dialog box opens.
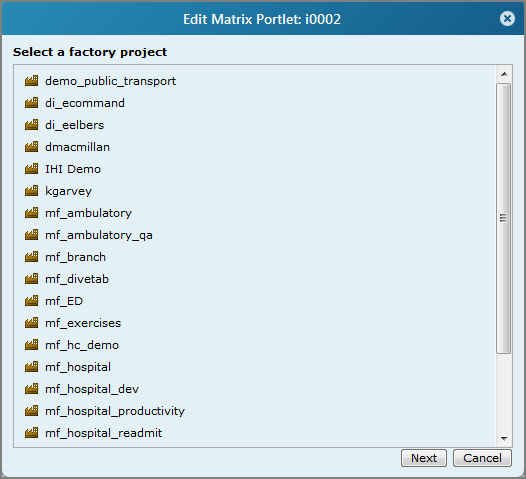
 -
Select a Measure Factory project.
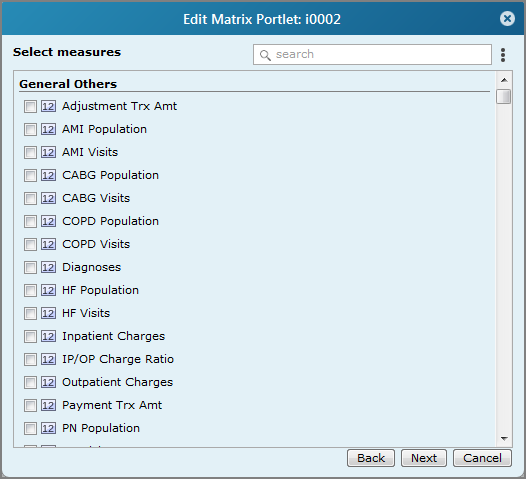
The wizard advances to the Select measures
dialog box. -
Select each measure that you want to display as a row on the portlet.
TIP: You can use the Search box to locate specific measures.
-
Click Next.
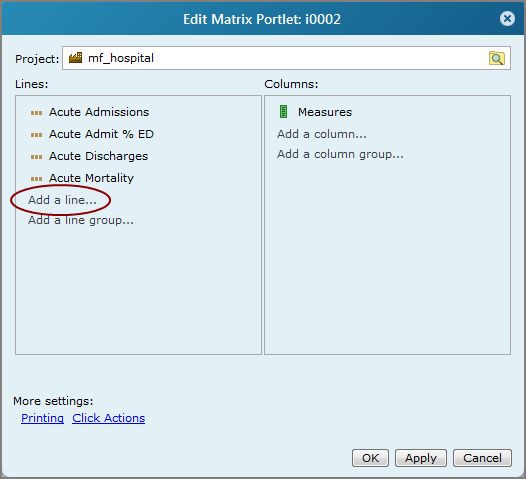
The wizard advances to the next page, which lists the selected measures in the Lines
text box, and the Measures column. -
If you want to customize the leftmost column heading, double-click Measures to open the Measure column settings dialog box.
-
If you want to add more measures, under
Lines, click Add a line -
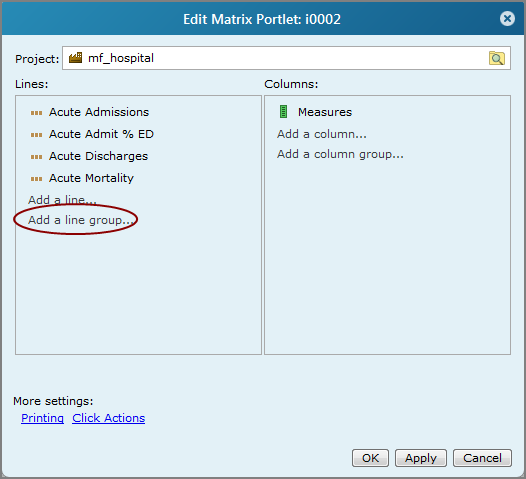
Optional. If you want to group the lines into categories, under
Lines, click Add a line group. The Line group settings dialog box opens.
-
Enter a line group Label, and then click OK.
The label is added to the bottom of the Lines section of the Edit Matrix Portlet
dialog box. - If you want to add more categories, continue to add line groups until you have entered them all.
-
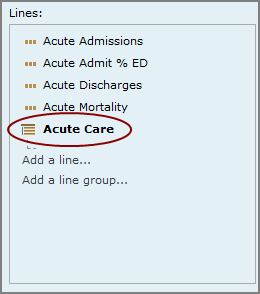
Use a drag-and-drop operation to move the line group labels to the top of each group of lines and then move the lines under the line group label, inside the dotted line.
In this
example, the line group is Acute Care, and the members of the group are the lines Acute Admissions, Acute Admit % ED, Acute Discharges, and Acute Mortality.TIP: You can tell the group labels from the lines because the lines and line groups have distinct icons.
 Line icon
 Line group icon
 -
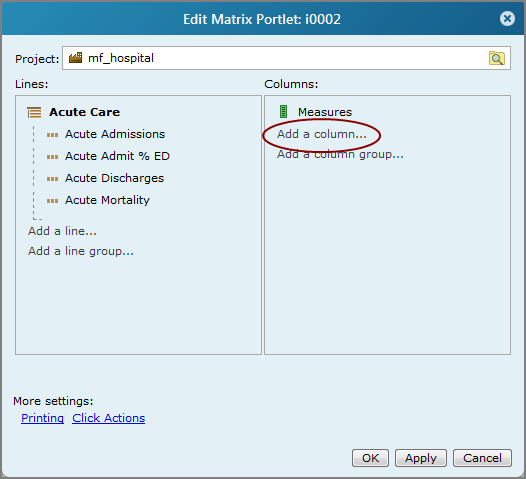
To add a data column to the portlet, on the Edit Matrix Portlet
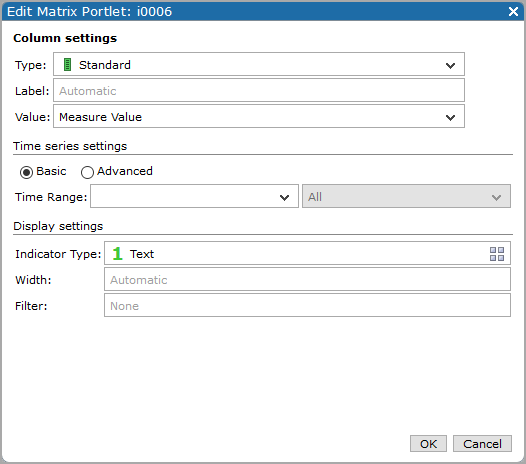
dialog box, Columns section, click Add a column. The Column settings
dialog box opens. -
Enter a Time Range and time period.
NOTE: If a Time Range QuickView has been added to the page, it appears as an option on this list.
TIP: Columns are labeled with the name of the measure by default, and the width is determined by the data display. To override these defaults, you can enter a different label in the Label box or enter a number (of pixels) in the Width box. For more information about label options, see Time Series Column Labels.
For information about the Advanced time series options, see Matrix Portlet Options. Look at the Details section of the Add a column table row.
-
If you want to select a different indicator type or add thresholds to the column, click the Edit indicator type
icon, and make the changes on the Display settings page. - Click OK.


For more information about option settings, see Matrix Portlet Options.
See also: